> ## Documentation Index
> Fetch the complete documentation index at: https://docs.loadforge.com/llms.txt
> Use this file to discover all available pages before exploring further.
# Core Web Vitals (CrUX)
> Monitor real user experience with Chrome User Experience Report data
Core Web Vitals are a set of specific factors that Google considers important for a webpage's overall user experience. LoadForge automatically collects and analyzes Chrome User Experience Report (CrUX) data to provide insights into how real users are experiencing your site.
## About CrUX Data
The **Chrome User Experience Report (CrUX)** collects anonymized, real-world performance data from Chrome users visiting your website. This provides valuable insights into actual user experiences rather than simulated tests.
CrUX data is updated monthly and requires sufficient traffic to your site to generate meaningful metrics. New or low-traffic sites may initially show "Insufficient data" for some metrics.
## Key Metrics
 ### HTTP/S Performance
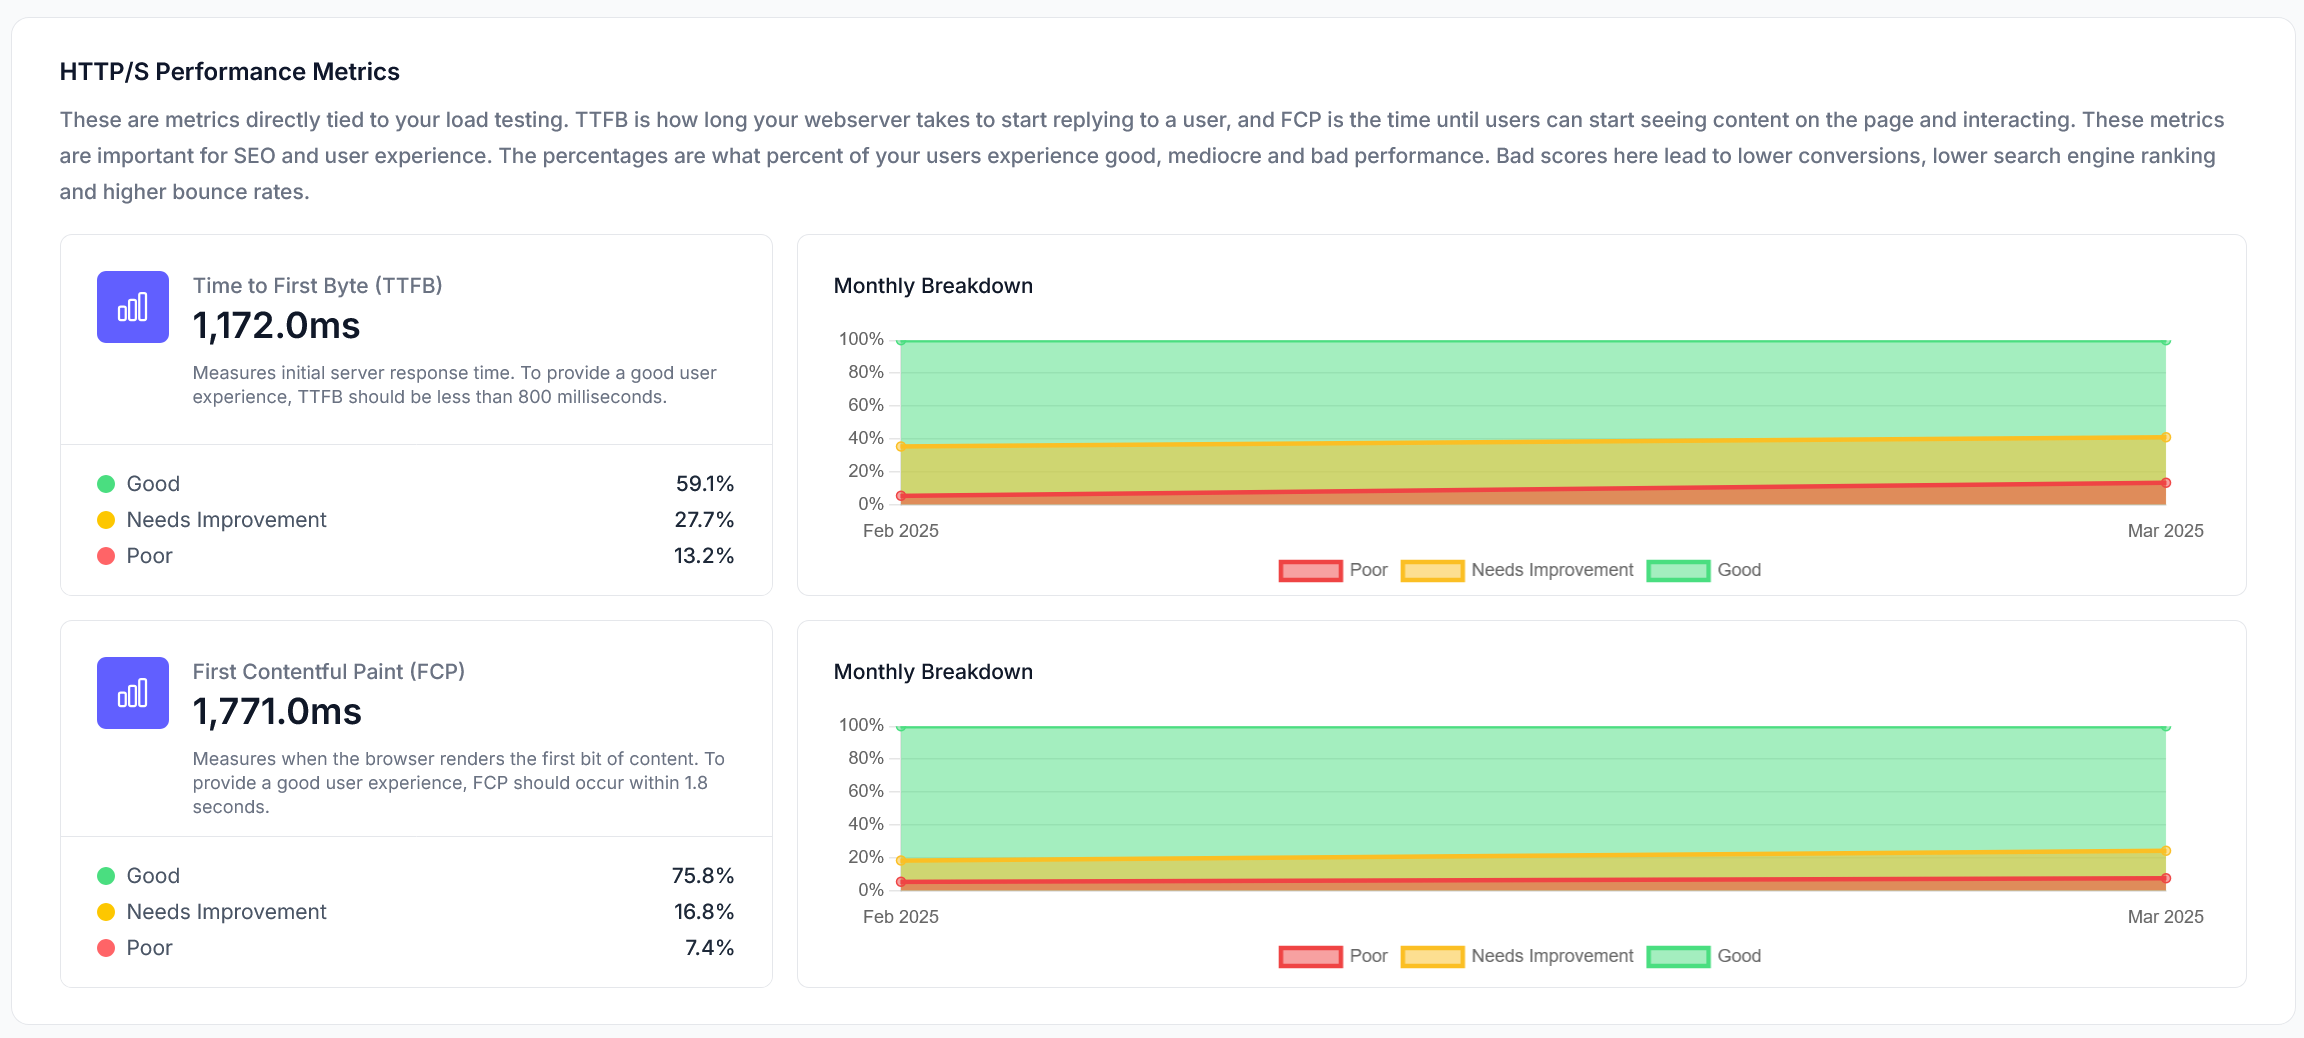 #### TTFB (Time to First Byte)
TTFB measures how long it takes for a user's browser to receive the first byte of response from your server after making a request.
* **Excellent**: Under 200ms
* **Good**: 200-500ms
* **Fair**: 500-1000ms
* **Poor**: Over 1000ms
To improve TTFB, focus on server optimization, implement caching strategies, optimize database queries, or consider upgrading your hosting resources.
#### FCP (First Contentful Paint)
FCP measures the time from when the page starts loading to when any part of the page's content is rendered on the screen.
* **Good**: Under 1.8 seconds
* **Needs Improvement**: 1.8-3.0 seconds
* **Poor**: Over 3.0 seconds
### Web Performance
#### TTFB (Time to First Byte)
TTFB measures how long it takes for a user's browser to receive the first byte of response from your server after making a request.
* **Excellent**: Under 200ms
* **Good**: 200-500ms
* **Fair**: 500-1000ms
* **Poor**: Over 1000ms
To improve TTFB, focus on server optimization, implement caching strategies, optimize database queries, or consider upgrading your hosting resources.
#### FCP (First Contentful Paint)
FCP measures the time from when the page starts loading to when any part of the page's content is rendered on the screen.
* **Good**: Under 1.8 seconds
* **Needs Improvement**: 1.8-3.0 seconds
* **Poor**: Over 3.0 seconds
### Web Performance
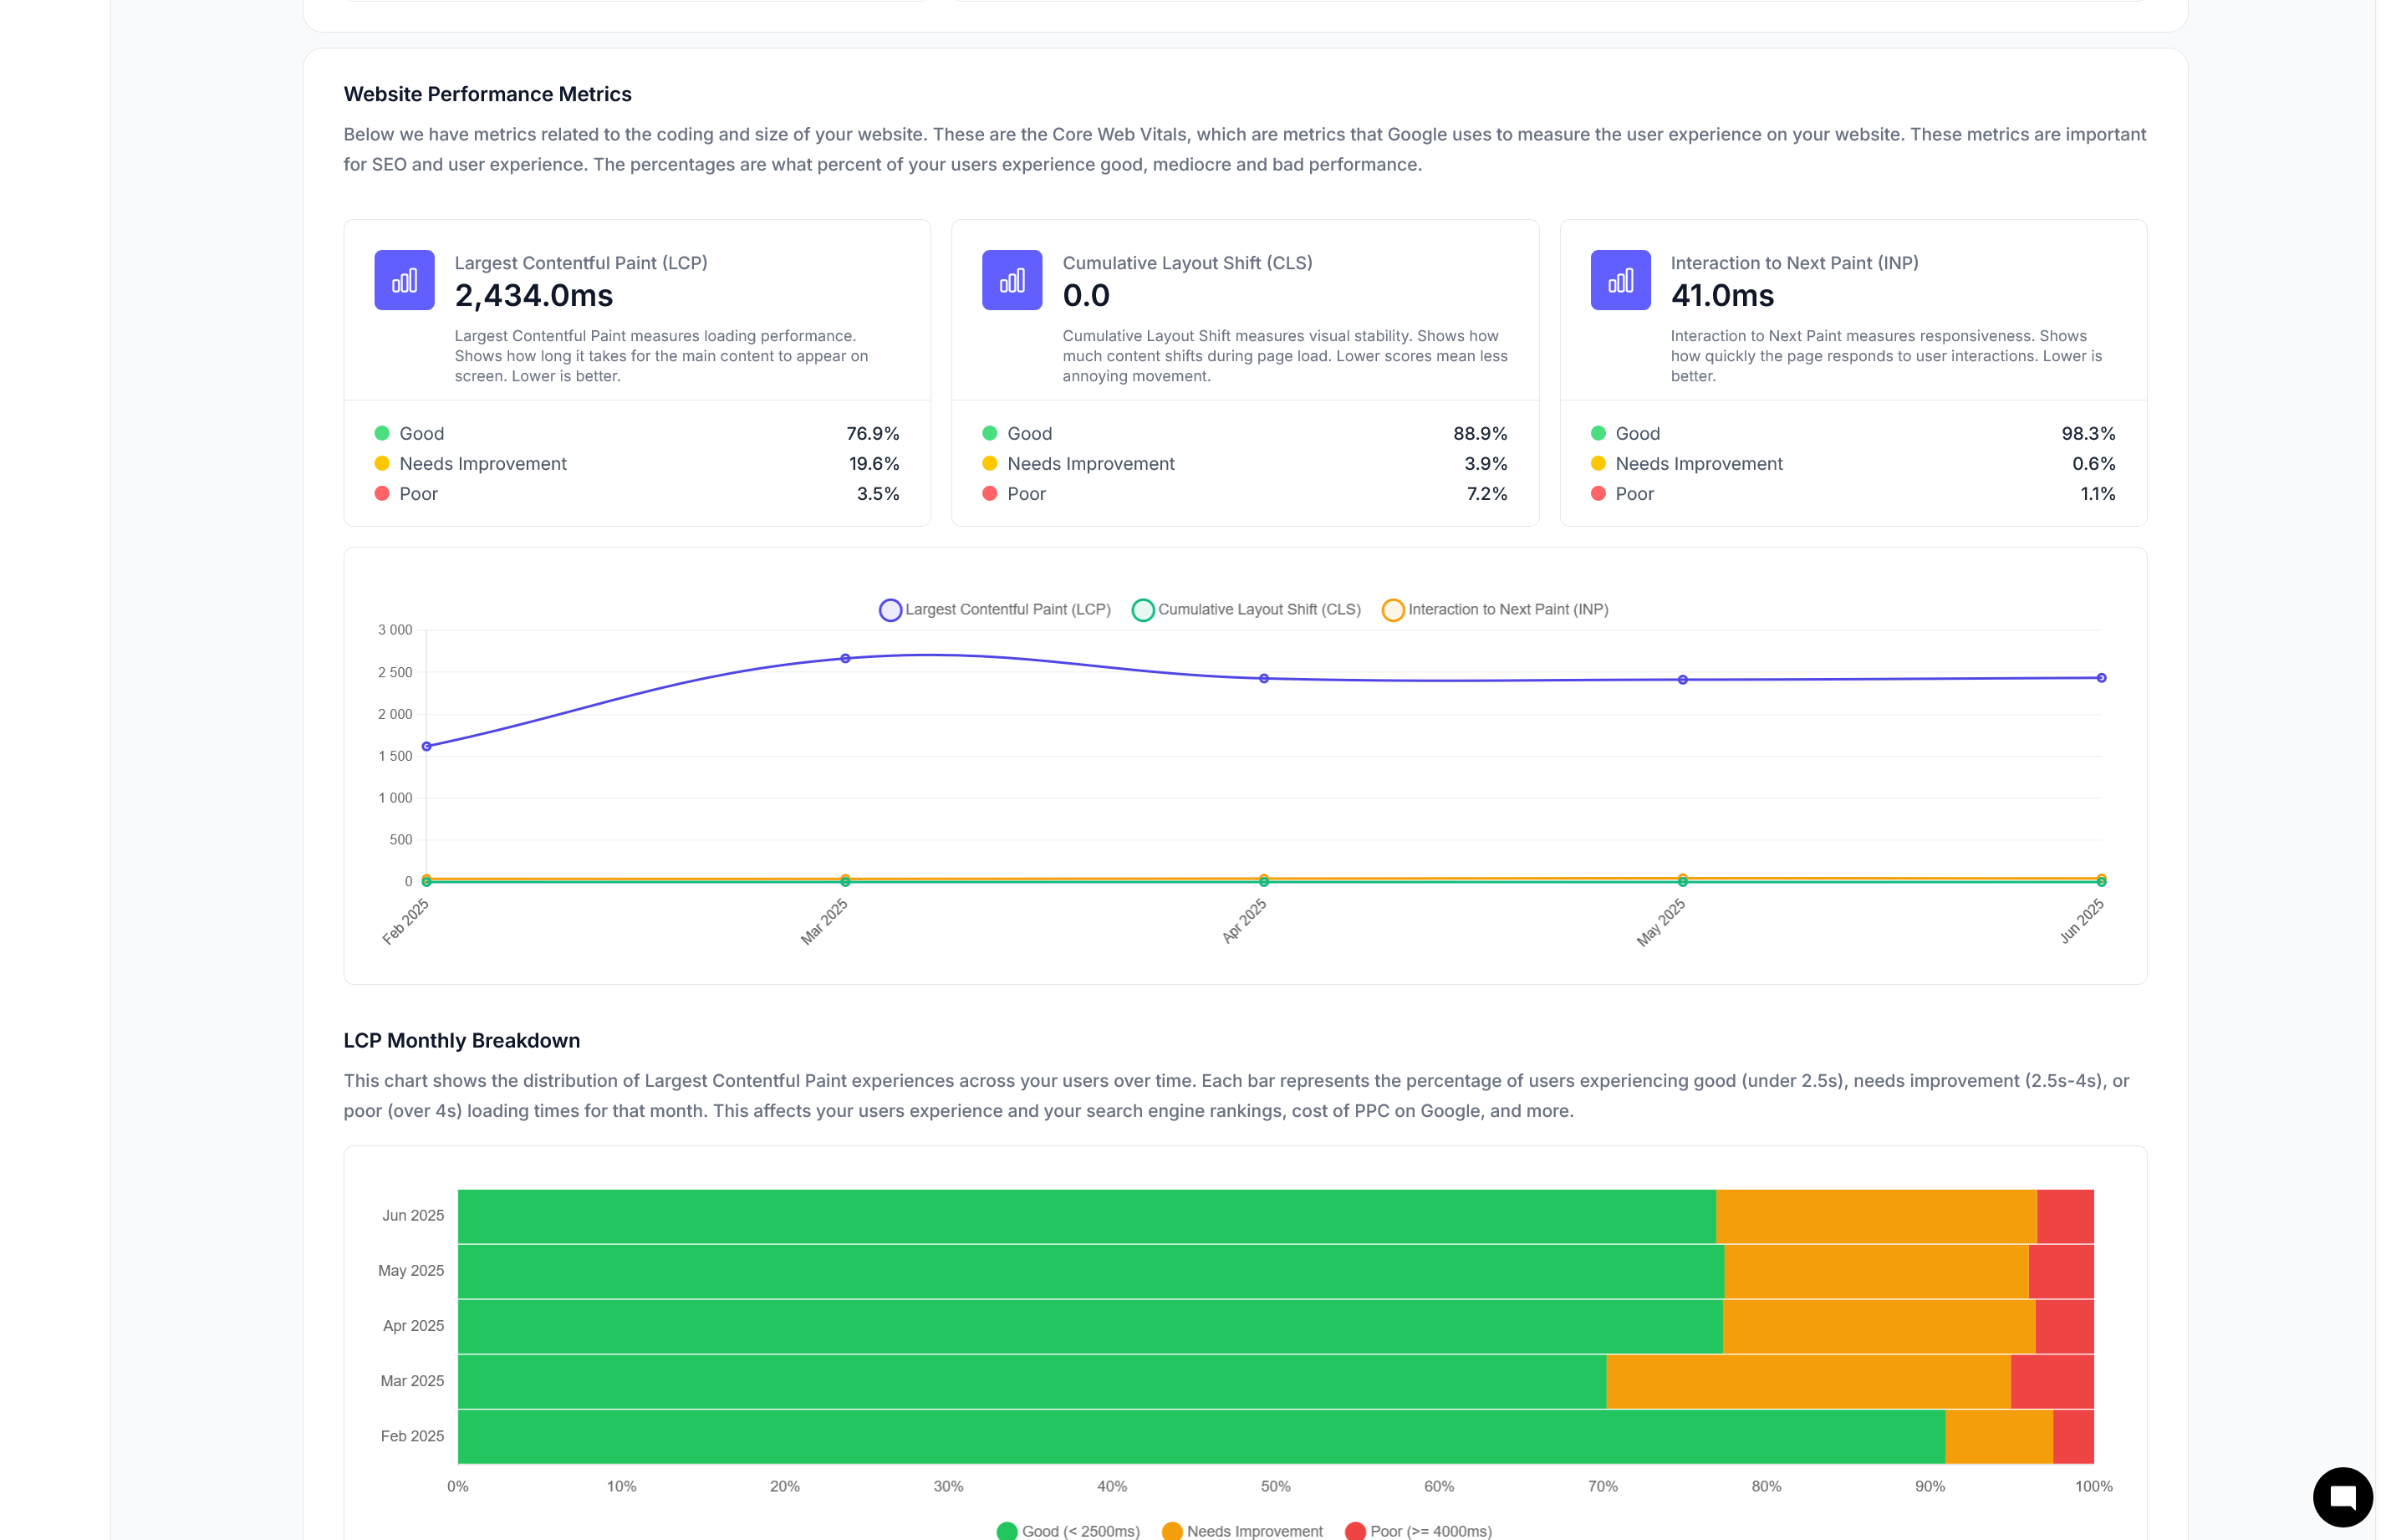
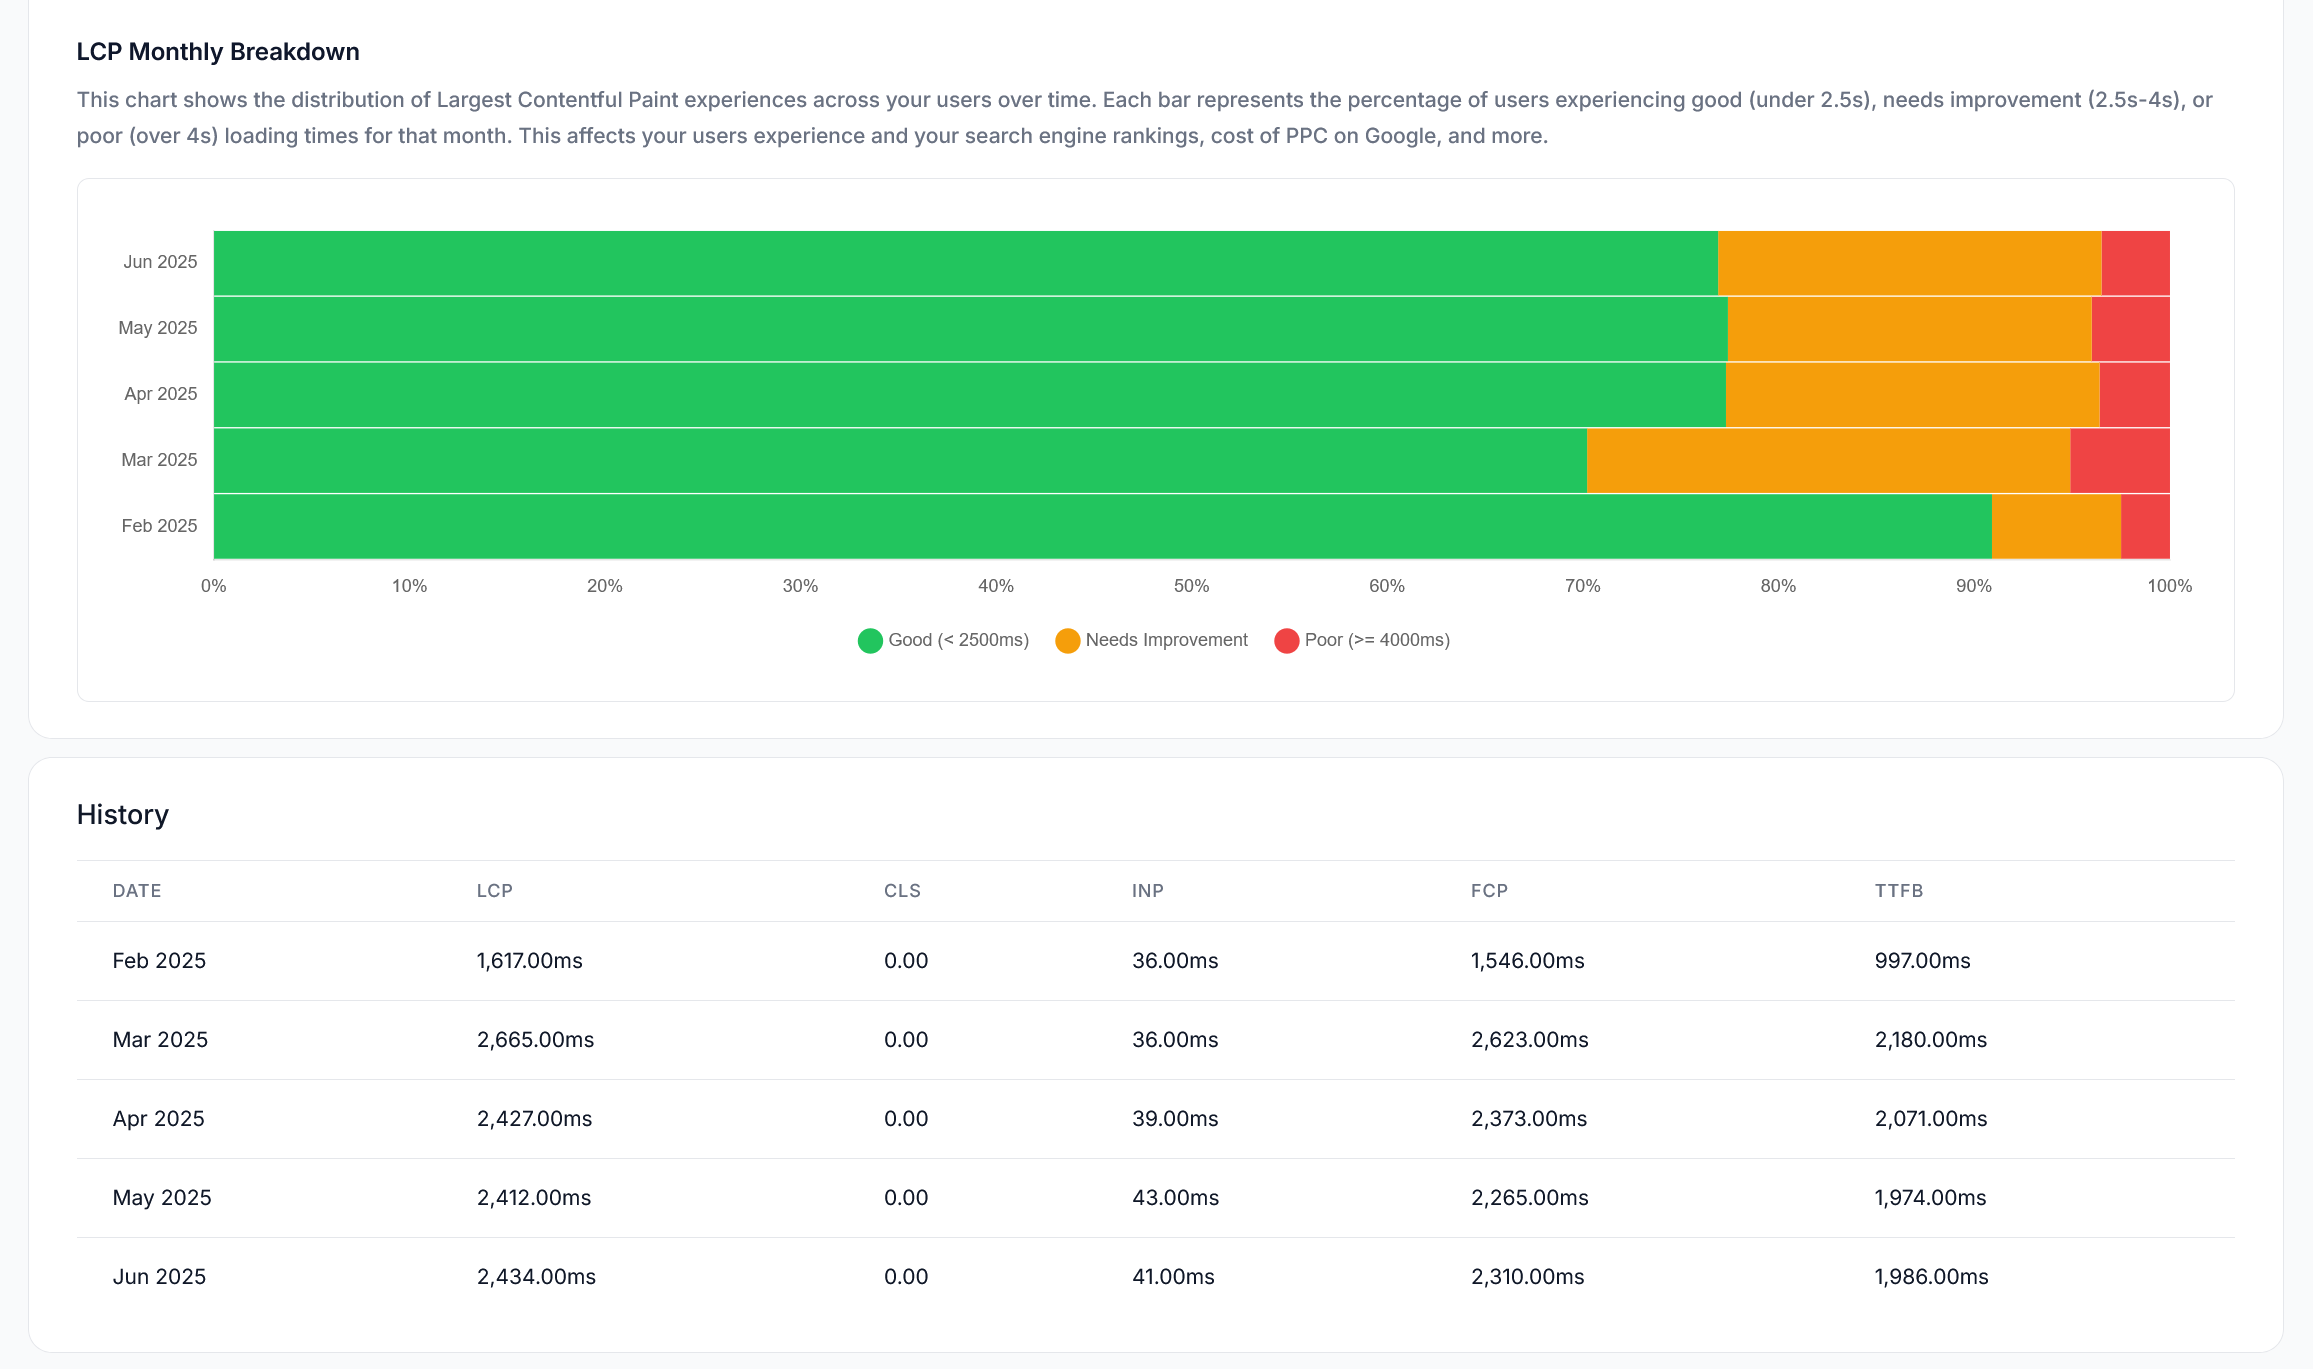
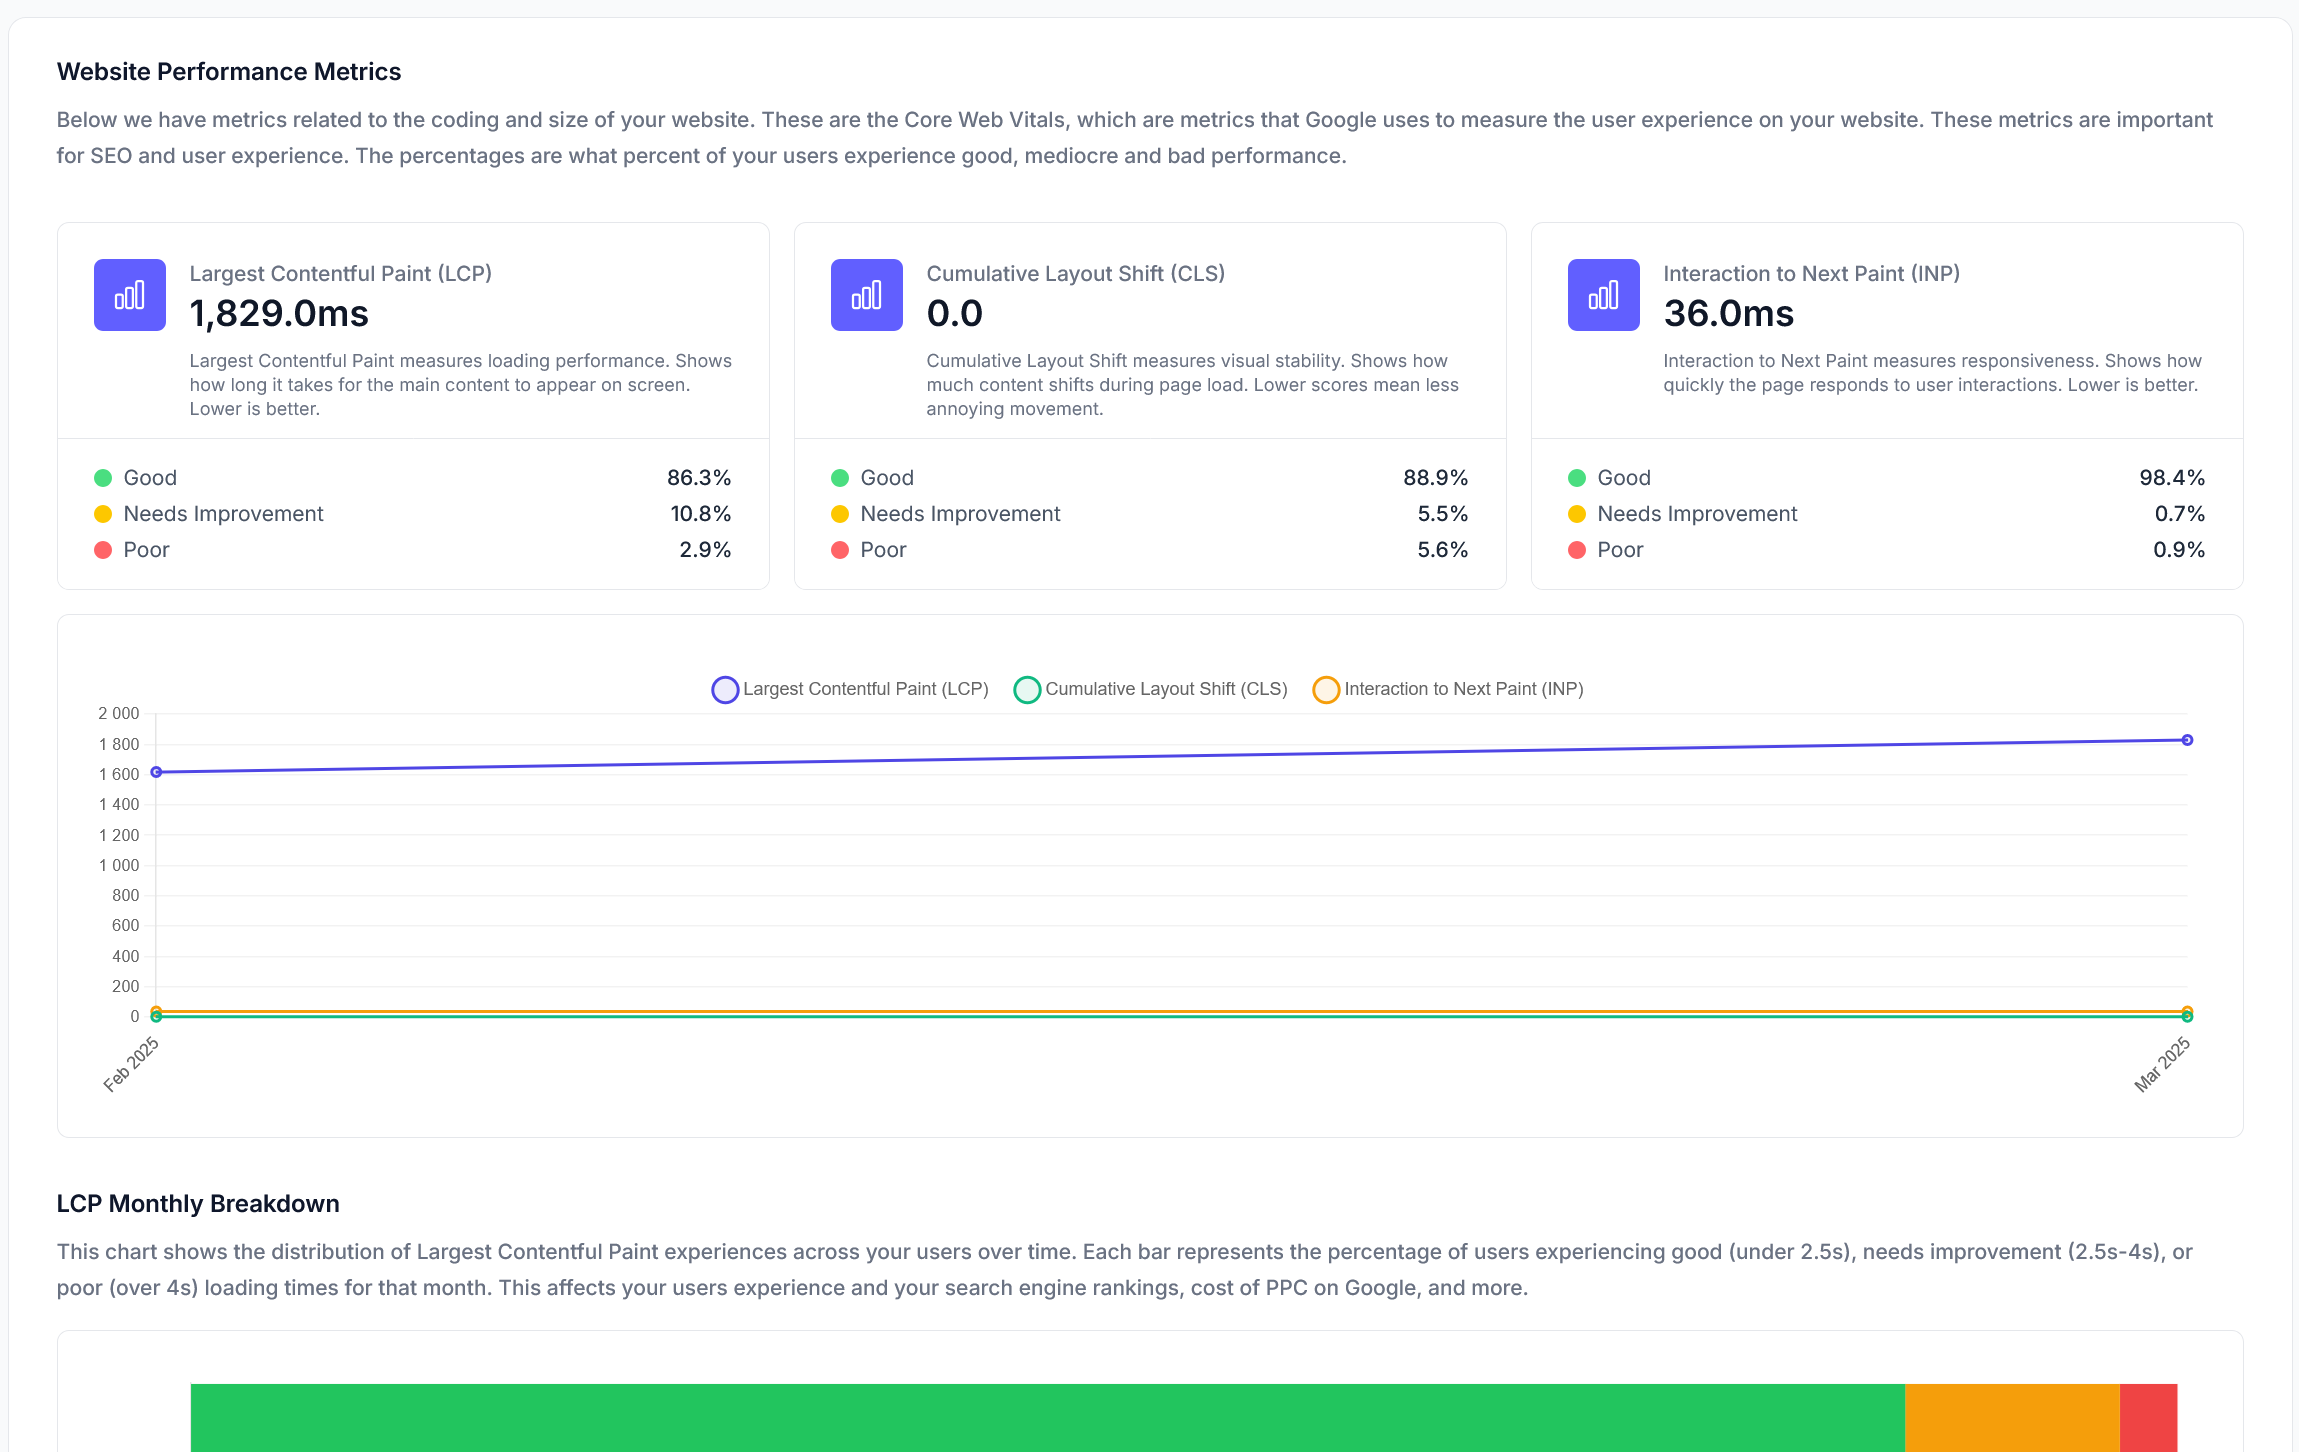 #### LCP (Largest Contentful Paint)
LCP measures the time it takes for the largest content element visible in the viewport to be rendered.
* **Good**: Under 2.5 seconds
* **Needs Improvement**: 2.5-4.0 seconds
* **Poor**: Over 4.0 seconds
#### CLS (Cumulative Layout Shift)
CLS measures the sum of all unexpected layout shifts that occur during the entire lifespan of the page.
* **Good**: Under 0.1
* **Needs Improvement**: 0.1-0.25
* **Poor**: Over 0.25
#### INP (Interaction to Next Paint)
INP measures the responsiveness of a page by observing the latency of all interactions a user makes with it.
* **Good**: Under 200ms
* **Needs Improvement**: 200-500ms
* **Poor**: Over 500ms
## Tracking Changes Over Time
LoadForge stores and tracks CrUX results monthly, allowing you to:
* Monitor performance trends over time
* Identify seasonal patterns that affect user experience
* Measure the impact of optimization efforts
* Detect regressions after site updates
#### LCP (Largest Contentful Paint)
LCP measures the time it takes for the largest content element visible in the viewport to be rendered.
* **Good**: Under 2.5 seconds
* **Needs Improvement**: 2.5-4.0 seconds
* **Poor**: Over 4.0 seconds
#### CLS (Cumulative Layout Shift)
CLS measures the sum of all unexpected layout shifts that occur during the entire lifespan of the page.
* **Good**: Under 0.1
* **Needs Improvement**: 0.1-0.25
* **Poor**: Over 0.25
#### INP (Interaction to Next Paint)
INP measures the responsiveness of a page by observing the latency of all interactions a user makes with it.
* **Good**: Under 200ms
* **Needs Improvement**: 200-500ms
* **Poor**: Over 500ms
## Tracking Changes Over Time
LoadForge stores and tracks CrUX results monthly, allowing you to:
* Monitor performance trends over time
* Identify seasonal patterns that affect user experience
* Measure the impact of optimization efforts
* Detect regressions after site updates
 ## Sub-Page Analysis
LoadForge not only tracks your main domain but also analyzes performance for key sub-pages, helping you:
* Identify specific pages with performance issues
* Prioritize optimization efforts based on page importance
* Compare performance across different sections of your site
## Why Core Web Vitals Matter
Core Web Vitals are critical for both user experience and SEO:
* **Google Search Ranking**: Core Web Vitals are direct ranking factors in Google's search algorithm
* **User Engagement**: Better metrics correlate with higher engagement and lower bounce rates
* **Conversion Rates**: Faster, smoother experiences lead to higher conversion rates
* **Mobile Experience**: Particularly important for mobile users, who often have less patience for slow sites
## Impact on LoadForge Score
Core Web Vitals account for **40%** of your overall [LoadForge Score](/performance/loadforge-score), making them the most heavily weighted component of your site's performance rating.
Learn about server response and uptime monitoring
Discover technical performance insights
## Sub-Page Analysis
LoadForge not only tracks your main domain but also analyzes performance for key sub-pages, helping you:
* Identify specific pages with performance issues
* Prioritize optimization efforts based on page importance
* Compare performance across different sections of your site
## Why Core Web Vitals Matter
Core Web Vitals are critical for both user experience and SEO:
* **Google Search Ranking**: Core Web Vitals are direct ranking factors in Google's search algorithm
* **User Engagement**: Better metrics correlate with higher engagement and lower bounce rates
* **Conversion Rates**: Faster, smoother experiences lead to higher conversion rates
* **Mobile Experience**: Particularly important for mobile users, who often have less patience for slow sites
## Impact on LoadForge Score
Core Web Vitals account for **40%** of your overall [LoadForge Score](/performance/loadforge-score), making them the most heavily weighted component of your site's performance rating.
Learn about server response and uptime monitoring
Discover technical performance insights