> ## Documentation Index
> Fetch the complete documentation index at: https://docs.loadforge.com/llms.txt
> Use this file to discover all available pages before exploring further.
# LoadForge Score
> Understanding the comprehensive LoadForge performance rating system
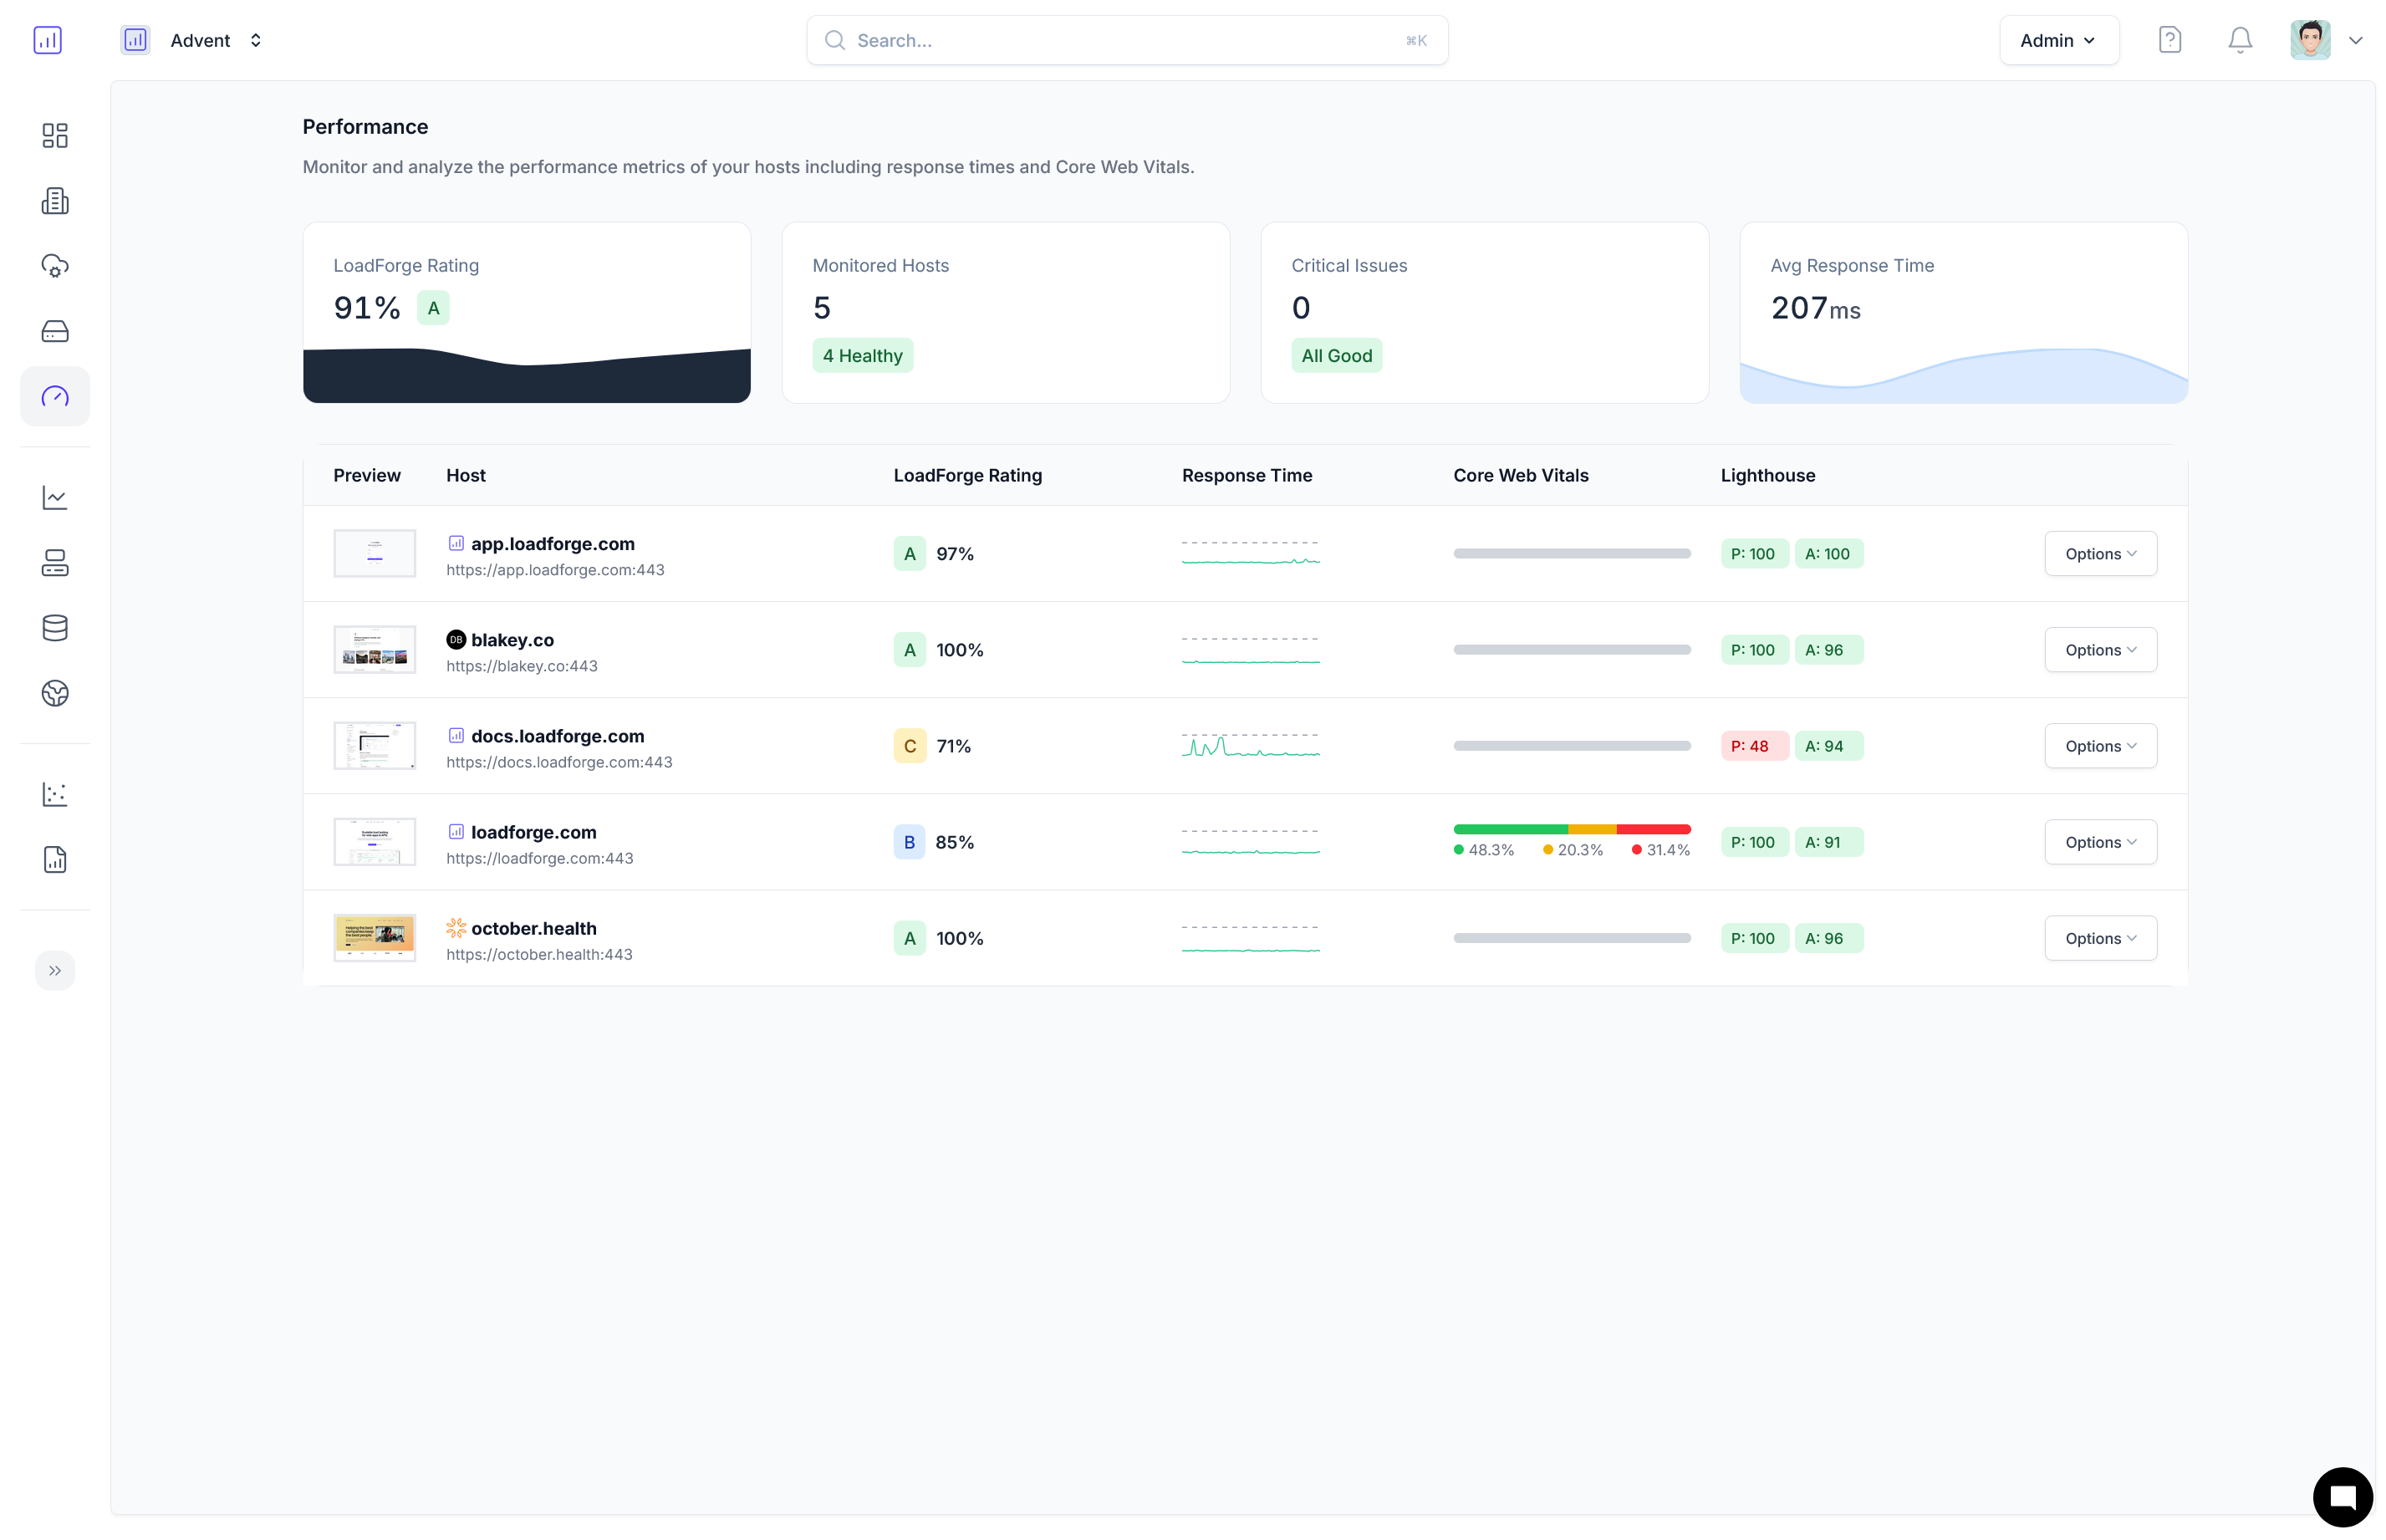
The LoadForge Score provides a comprehensive assessment of your website's performance across multiple dimensions. This unified scoring system helps you quickly understand your site's overall health and identify areas for improvement.
## How It Works
The LoadForge Score combines data from multiple performance metrics to generate a single, easy-to-understand letter grade (A-F) that represents your site's overall performance.
### Weighted Scoring Components
 Your overall score is calculated based on a weighted average of three key performance areas:
* **40% Core Web Vitals** - Real user experience metrics from CrUX data:
* Time to First Byte (TTFB)
* First Contentful Paint (FCP)
* Largest Contentful Paint (LCP)
* Cumulative Layout Shift (CLS)
* Interaction to Next Paint (INP)
* **30% Response Time** - Server performance metrics:
* Average response time
* Response time consistency
* Uptime percentage
* **30% Lighthouse Performance** - Technical performance metrics:
* Overall performance score
* Accessibility score
* Best practices score
* SEO score
## Rating Scale
90-100%: Excellent performance across all metrics
80-89%: Good performance with minor improvements needed
70-79%: Fair performance with several areas for improvement
60-69%: Poor performance requiring significant optimization
0-59%: Very poor performance requiring urgent attention
If your site has insufficient data in any category, you'll see a gray "N/A" badge. Continue monitoring to generate enough data for a complete score.
## Why It Matters
The LoadForge Score is more than just a number—it directly correlates with user experience and business metrics:
* **User Retention**: Sites with A or B scores typically have 25% higher user retention rates
* **Conversion Rates**: Each letter grade improvement correlates with a 7-12% increase in conversion rates
* **SEO Rankings**: Higher scores often translate to better search engine visibility
* **Bounce Rate**: Lower-scoring sites experience bounce rates up to 40% higher than high-scoring sites
## Improving Your Score
To improve your LoadForge Score, focus on the specific components where your site is underperforming:
Optimize real user experience metrics
Improve server response and reliability
Enhance technical performance aspects
Your overall score is calculated based on a weighted average of three key performance areas:
* **40% Core Web Vitals** - Real user experience metrics from CrUX data:
* Time to First Byte (TTFB)
* First Contentful Paint (FCP)
* Largest Contentful Paint (LCP)
* Cumulative Layout Shift (CLS)
* Interaction to Next Paint (INP)
* **30% Response Time** - Server performance metrics:
* Average response time
* Response time consistency
* Uptime percentage
* **30% Lighthouse Performance** - Technical performance metrics:
* Overall performance score
* Accessibility score
* Best practices score
* SEO score
## Rating Scale
90-100%: Excellent performance across all metrics
80-89%: Good performance with minor improvements needed
70-79%: Fair performance with several areas for improvement
60-69%: Poor performance requiring significant optimization
0-59%: Very poor performance requiring urgent attention
If your site has insufficient data in any category, you'll see a gray "N/A" badge. Continue monitoring to generate enough data for a complete score.
## Why It Matters
The LoadForge Score is more than just a number—it directly correlates with user experience and business metrics:
* **User Retention**: Sites with A or B scores typically have 25% higher user retention rates
* **Conversion Rates**: Each letter grade improvement correlates with a 7-12% increase in conversion rates
* **SEO Rankings**: Higher scores often translate to better search engine visibility
* **Bounce Rate**: Lower-scoring sites experience bounce rates up to 40% higher than high-scoring sites
## Improving Your Score
To improve your LoadForge Score, focus on the specific components where your site is underperforming:
Optimize real user experience metrics
Improve server response and reliability
Enhance technical performance aspects