> ## Documentation Index
> Fetch the complete documentation index at: https://docs.loadforge.com/llms.txt
> Use this file to discover all available pages before exploring further.
# Response Times & Uptime
> Monitor your server's response times and uptime performance
Response time monitoring provides critical insights into your server's performance and reliability. LoadForge continuously monitors your host's response times and uptime, helping you identify and resolve performance issues before they impact your users.
## How It Works
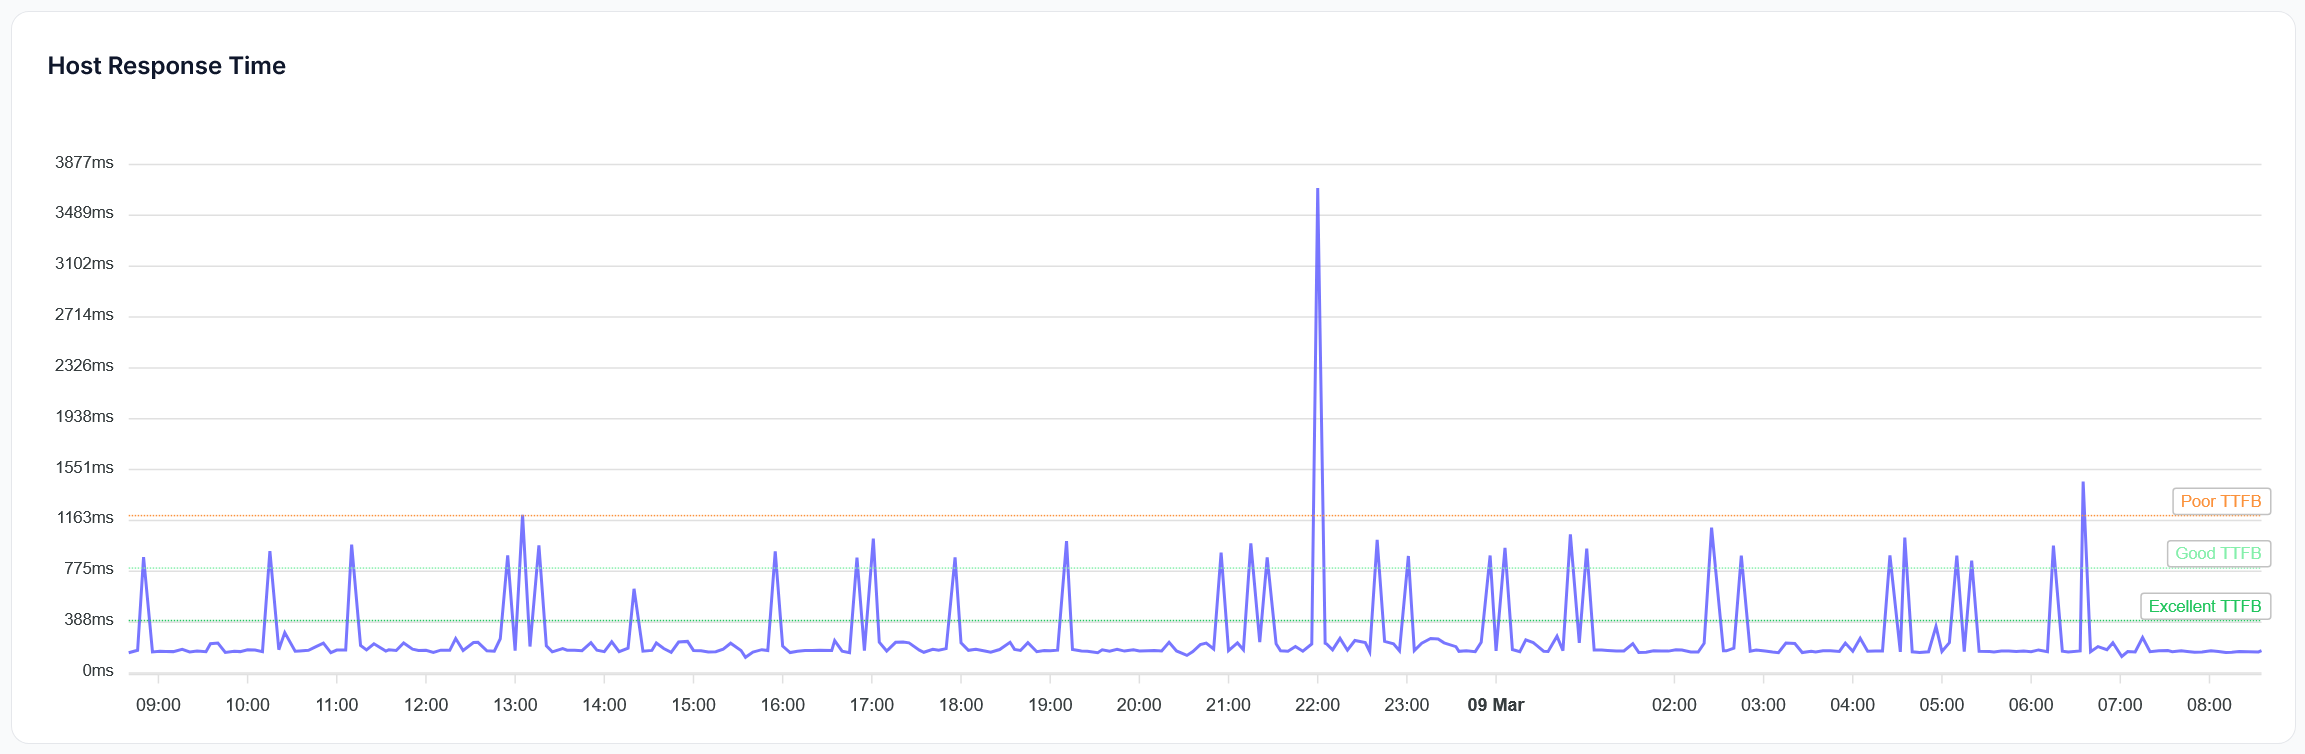
LoadForge checks the health of your host **every 5 minutes** and records detailed response time metrics. This data is analyzed to provide both real-time alerts and historical performance trends.
 ## Key Metrics
### Response Time
Response time measures how quickly your server responds to requests, directly impacting user experience and satisfaction. LoadForge tracks:
* **Average Response Time**: The mean time it takes for your server to respond to requests
* **Response Time Distribution**: How response times vary across different percentiles
* **Time-of-Day Patterns**: Identifying peak load times that may affect performance
### Uptime
Uptime monitoring tracks the availability of your service, ensuring that your application remains accessible to users. LoadForge provides:
* **Real-Time Status**: Immediate notification if your service becomes unavailable
* **Uptime Percentage**: Historical record of your service's reliability
* **Downtime Analysis**: Insights into patterns or causes of service interruptions
## Response Time Ratings
LoadForge categorizes response times into performance brackets to help you quickly assess your server's performance:
Under 200ms
200-500ms
500-1000ms
Over 1000ms
## Percentile Distribution
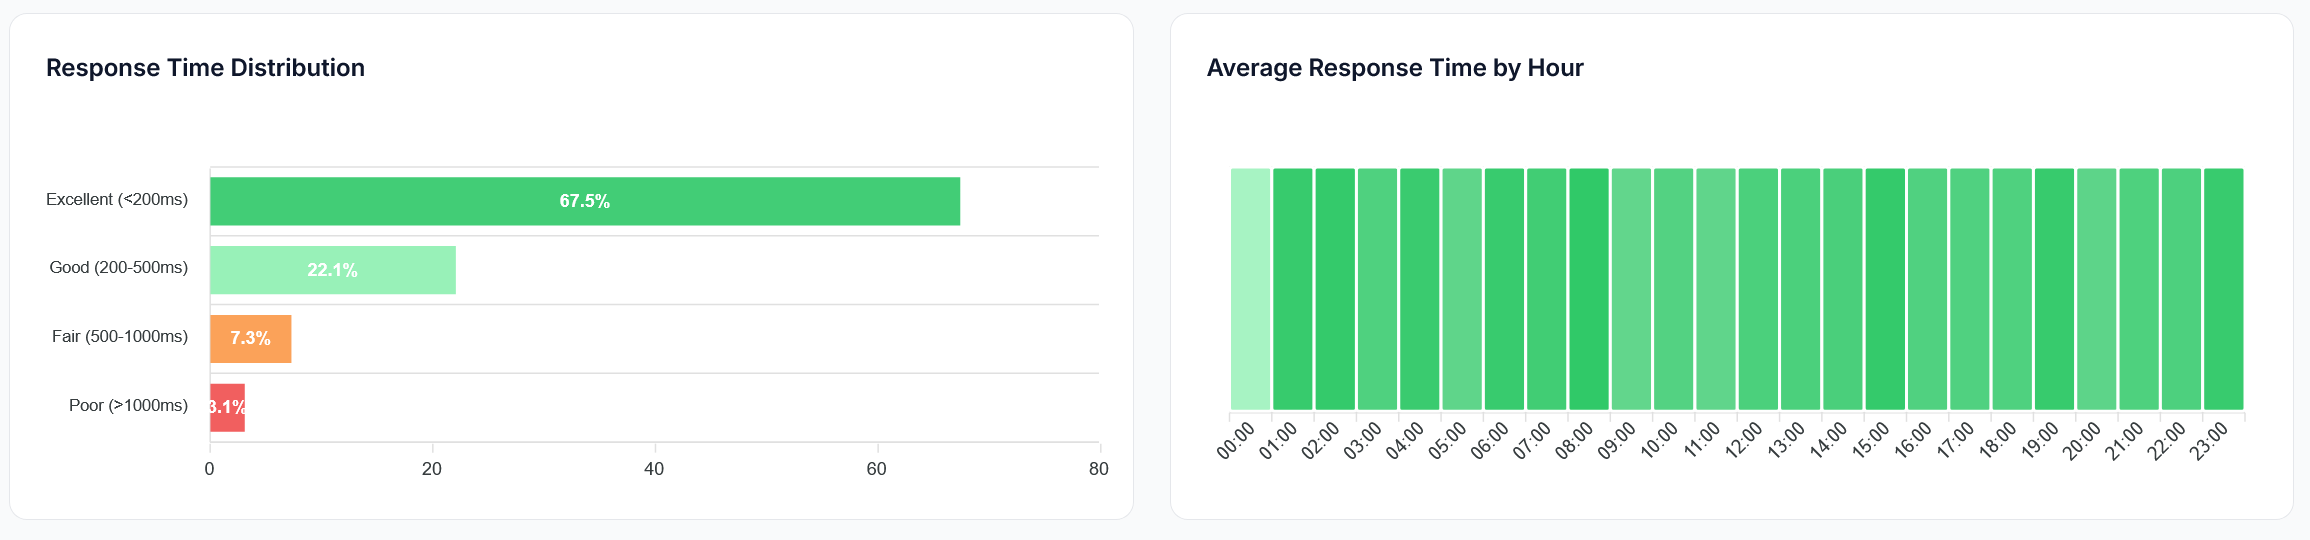
LoadForge provides two key distribution charts to help you understand your response time patterns:
1. **Performance Brackets**: Shows what percentage of responses fall into each performance category
2. **Time-of-Day Variation**: Identifies peak load times that may be affecting performance
## Key Metrics
### Response Time
Response time measures how quickly your server responds to requests, directly impacting user experience and satisfaction. LoadForge tracks:
* **Average Response Time**: The mean time it takes for your server to respond to requests
* **Response Time Distribution**: How response times vary across different percentiles
* **Time-of-Day Patterns**: Identifying peak load times that may affect performance
### Uptime
Uptime monitoring tracks the availability of your service, ensuring that your application remains accessible to users. LoadForge provides:
* **Real-Time Status**: Immediate notification if your service becomes unavailable
* **Uptime Percentage**: Historical record of your service's reliability
* **Downtime Analysis**: Insights into patterns or causes of service interruptions
## Response Time Ratings
LoadForge categorizes response times into performance brackets to help you quickly assess your server's performance:
Under 200ms
200-500ms
500-1000ms
Over 1000ms
## Percentile Distribution
LoadForge provides two key distribution charts to help you understand your response time patterns:
1. **Performance Brackets**: Shows what percentage of responses fall into each performance category
2. **Time-of-Day Variation**: Identifies peak load times that may be affecting performance
 ## Alerts & Notifications
Configure different alert thresholds for different team members. Technical staff might need immediate alerts for minor issues, while management may only need notifications for significant problems.
LoadForge provides real-time alerts when your host:
* Becomes unresponsive
* Experiences a significant performance drop
* Shows a pattern of degrading response times
Alerts can be delivered via:
* Email (default)
* Slack integration
* Zapier webhooks
## Historical Analysis
Historical response time data allows you to:
* Track long-term performance trends
* Identify gradual slowdowns before they become critical
* Compare performance before and after infrastructure changes
* Correlate response time issues with specific events or changes
## Impact on LoadForge Score
Response time metrics account for **30%** of your overall [LoadForge Score](/performance/loadforge-score), making them a critical component of your site's performance rating.
Learn about real user experience metrics
Discover technical performance insights
## Alerts & Notifications
Configure different alert thresholds for different team members. Technical staff might need immediate alerts for minor issues, while management may only need notifications for significant problems.
LoadForge provides real-time alerts when your host:
* Becomes unresponsive
* Experiences a significant performance drop
* Shows a pattern of degrading response times
Alerts can be delivered via:
* Email (default)
* Slack integration
* Zapier webhooks
## Historical Analysis
Historical response time data allows you to:
* Track long-term performance trends
* Identify gradual slowdowns before they become critical
* Compare performance before and after infrastructure changes
* Correlate response time issues with specific events or changes
## Impact on LoadForge Score
Response time metrics account for **30%** of your overall [LoadForge Score](/performance/loadforge-score), making them a critical component of your site's performance rating.
Learn about real user experience metrics
Discover technical performance insights