> ## Documentation Index
> Fetch the complete documentation index at: https://docs.loadforge.com/llms.txt
> Use this file to discover all available pages before exploring further.
# Apdex
> Learn how Apdex scoring works and how LoadForge helps you measure performance.
Apdex (**Application Performance Index**) is a standardized way to measure and interpret application response times based on user experience. It provides a simple numerical score representing **how satisfied users are with performance**.
## How Apdex Works
Apdex scores are based on response time thresholds:
* **Satisfied (Fast Response)**: Requests that complete within the target response time.
* **Tolerating (Acceptable Response)**: Requests that take longer but are still within an acceptable range (typically **4x the target response time**).
* **Frustrated (Slow Response)**: Requests that exceed the tolerable threshold, indicating poor performance.
The formula for **Apdex score**:
```plaintext theme={null}
Apdex = (Satisfied Requests + (Tolerating Requests / 2)) / Total Requests
```
* **1.0** = Excellent performance (all users satisfied)
* **0.85+** = Good performance
* **0.7 - 0.85** = Fair performance, potential for improvement
* **Below 0.7** = Poor performance, significant user frustration
## Apdex in LoadForge
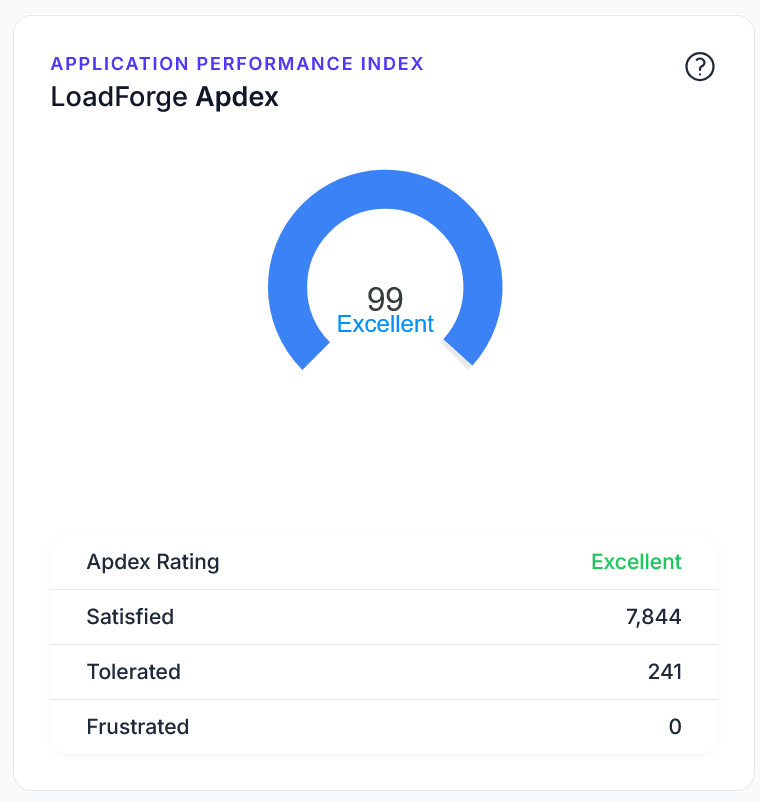
LoadForge automatically calculates **Apdex scores** for every test and displays them in the **test results page**. This helps you quickly assess whether your site or API is performing as expected.
### Where to Find Your Apdex Score
* Every test run result in LoadForge includes an **Apdex calculation**.
* The Apdex score is displayed alongside **response time statistics (P95, average)** and **error rates**.
* If your Apdex score is **below your target**, LoadForge will **mark the test as failed**.
### Inside of a Run Result
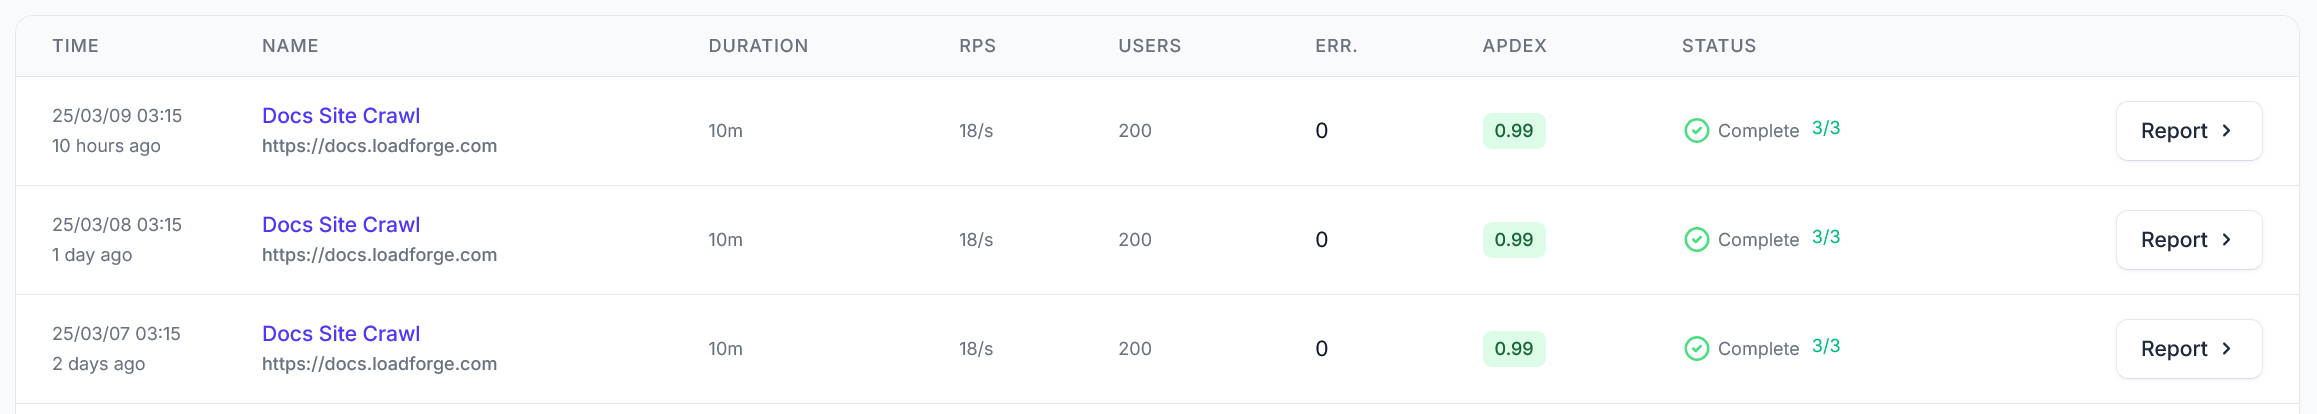
 ### On the List of Runs
 ## Setting Your Apdex Target
Start with a more lenient Apdex target (higher ms) and gradually decrease it as you optimize your application. This creates achievable milestones for your team.
When creating a test, you can define an **Apdex Target Response Time (in milliseconds)**. This is the response time under which requests are considered "satisfied."
### Recommended Apdex Targets
| Application Type | Suggested Apdex Target |
| ----------------------- | ---------------------- |
| Static Websites | **200ms - 500ms** |
| APIs & Web Services | **300ms - 800ms** |
| E-Commerce Sites | **500ms - 1000ms** |
| Enterprise Applications | **1000ms - 2000ms** |
## How to Improve Your Apdex Score
If your Apdex score is low, consider optimizing:
1. **Backend Performance**: Reduce database query times, optimize API calls.
2. **Caching**: Use caching layers (Redis, Cloudflare, etc.) to speed up response times.
3. **Scaling**: Increase server capacity or use auto-scaling for high-traffic periods.
4. **Content Optimization**: Minimize JavaScript execution, optimize images, and reduce page load times.
5. **CDN Usage**: Distribute static content across global locations to improve response times.
## Conclusion
Apdex provides an **objective measure of performance** that aligns with user experience. LoadForge integrates Apdex scoring **directly into test results**, making it easy to assess whether your application meets performance expectations.
By **setting realistic Apdex targets and monitoring test results**, you can continuously improve the responsiveness and reliability of your services.
Learn how to interpret load test results and optimize performance
Compare different test runs to track improvements over time
## Setting Your Apdex Target
Start with a more lenient Apdex target (higher ms) and gradually decrease it as you optimize your application. This creates achievable milestones for your team.
When creating a test, you can define an **Apdex Target Response Time (in milliseconds)**. This is the response time under which requests are considered "satisfied."
### Recommended Apdex Targets
| Application Type | Suggested Apdex Target |
| ----------------------- | ---------------------- |
| Static Websites | **200ms - 500ms** |
| APIs & Web Services | **300ms - 800ms** |
| E-Commerce Sites | **500ms - 1000ms** |
| Enterprise Applications | **1000ms - 2000ms** |
## How to Improve Your Apdex Score
If your Apdex score is low, consider optimizing:
1. **Backend Performance**: Reduce database query times, optimize API calls.
2. **Caching**: Use caching layers (Redis, Cloudflare, etc.) to speed up response times.
3. **Scaling**: Increase server capacity or use auto-scaling for high-traffic periods.
4. **Content Optimization**: Minimize JavaScript execution, optimize images, and reduce page load times.
5. **CDN Usage**: Distribute static content across global locations to improve response times.
## Conclusion
Apdex provides an **objective measure of performance** that aligns with user experience. LoadForge integrates Apdex scoring **directly into test results**, making it easy to assess whether your application meets performance expectations.
By **setting realistic Apdex targets and monitoring test results**, you can continuously improve the responsiveness and reliability of your services.
Learn how to interpret load test results and optimize performance
Compare different test runs to track improvements over time