> ## Documentation Index
> Fetch the complete documentation index at: https://docs.loadforge.com/llms.txt
> Use this file to discover all available pages before exploring further.
# Comparing Runs
> How to compare different test runs in LoadForge.
LoadForge makes it easy to **compare test runs** so you can track performance improvements, detect regressions, and analyze test history over time. There are two main ways to compare runs:
* **Runs Per Test View**: View all historical runs of a test in one place.
* **Compare View**: Directly compare two test runs side by side.
## Runs Per Test View
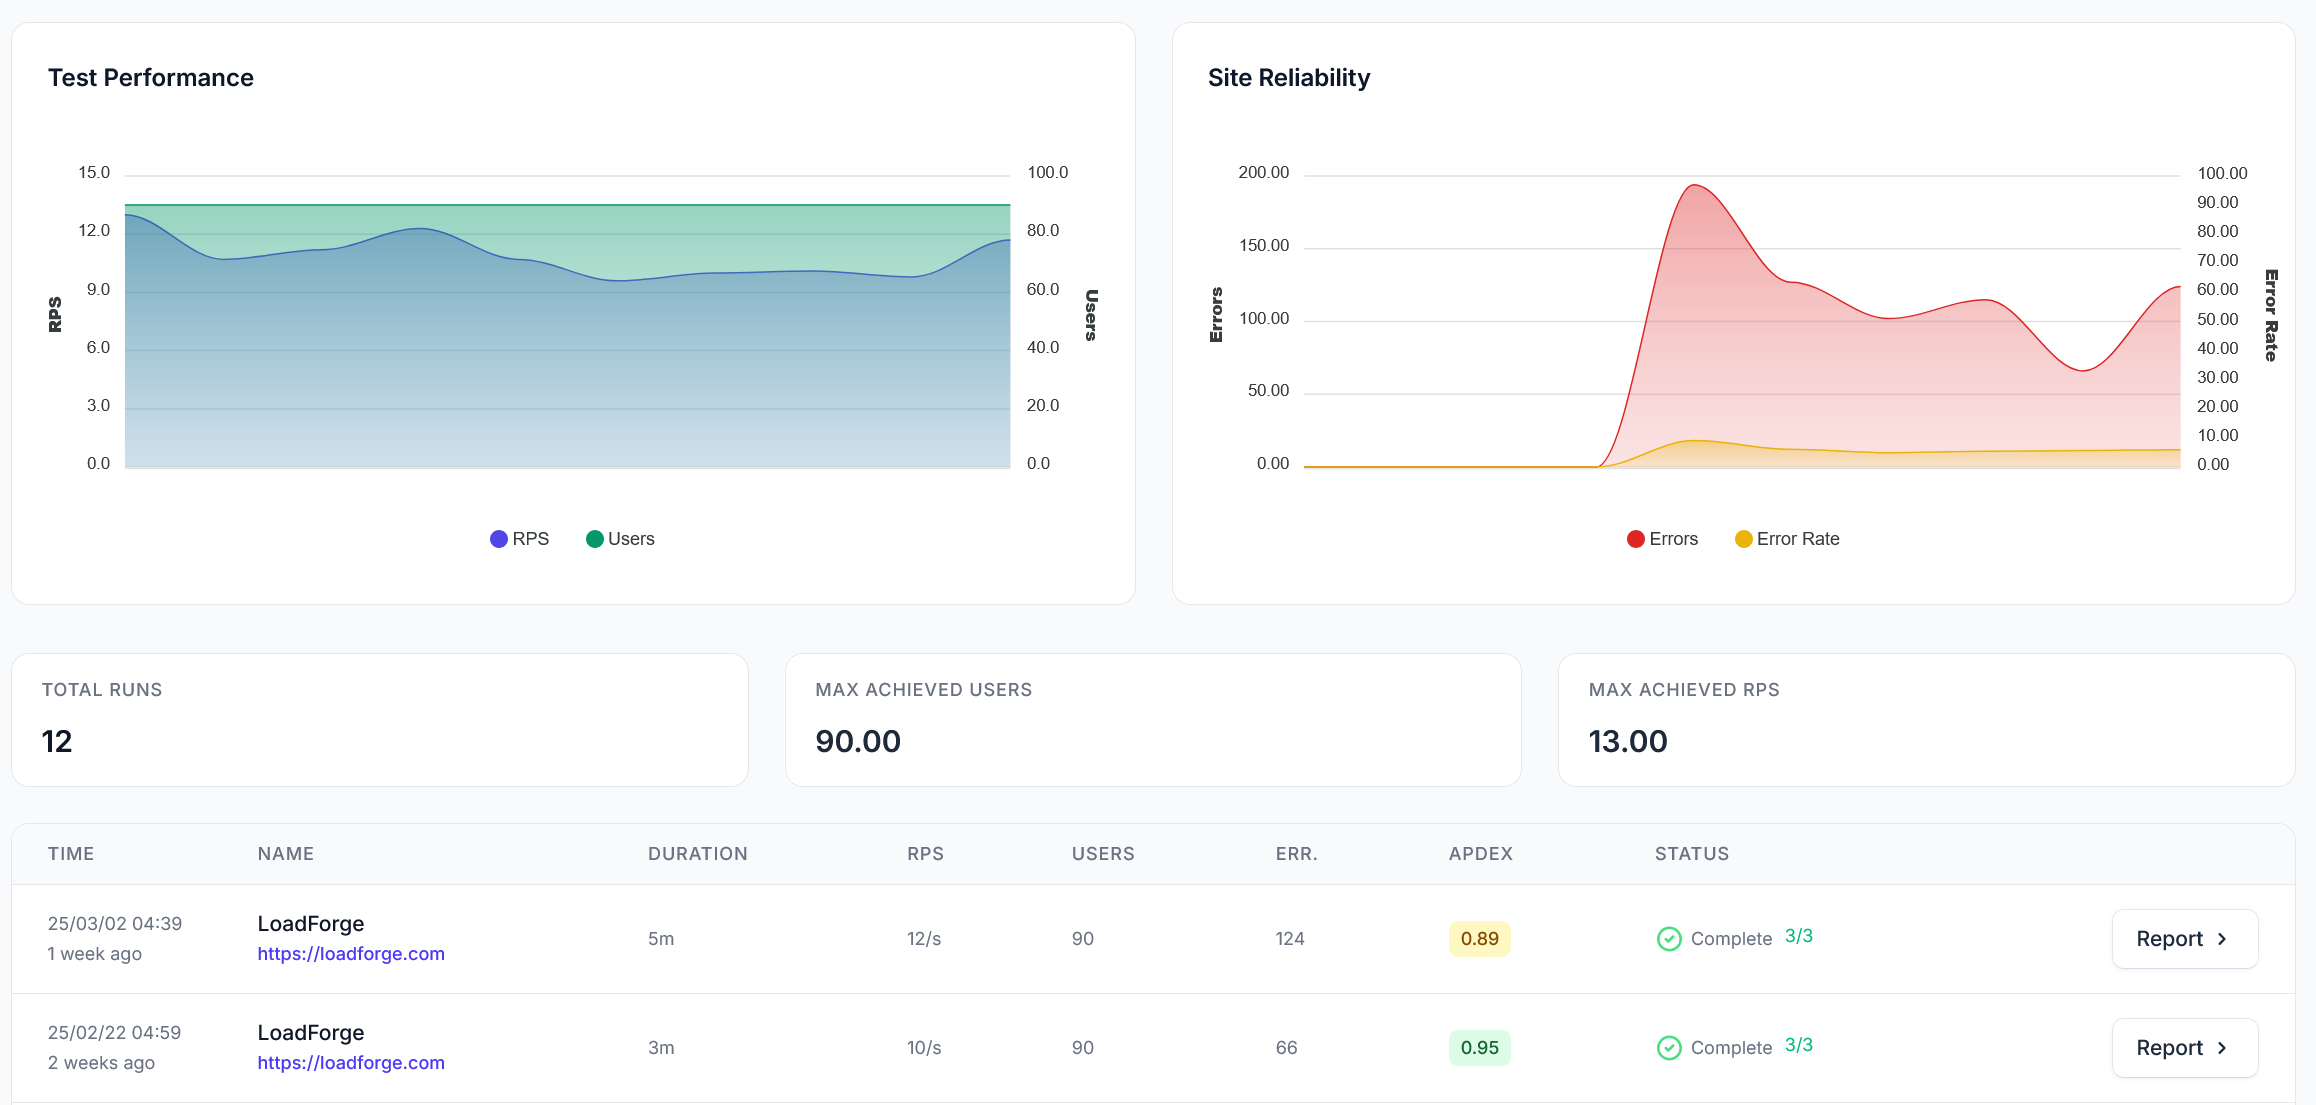 The **Runs Per Test** page groups test runs by the specific test, allowing you to:
* See all historical runs for a particular test.
* Track **trends in performance, Apdex scores, error rates, and response times**.
* Identify how your application behaves under load over time.
Use this view to spot trends. If Apdex scores or response times gradually degrade, your infrastructure may need optimization.
## Compare View
The **Runs Per Test** page groups test runs by the specific test, allowing you to:
* See all historical runs for a particular test.
* Track **trends in performance, Apdex scores, error rates, and response times**.
* Identify how your application behaves under load over time.
Use this view to spot trends. If Apdex scores or response times gradually degrade, your infrastructure may need optimization.
## Compare View
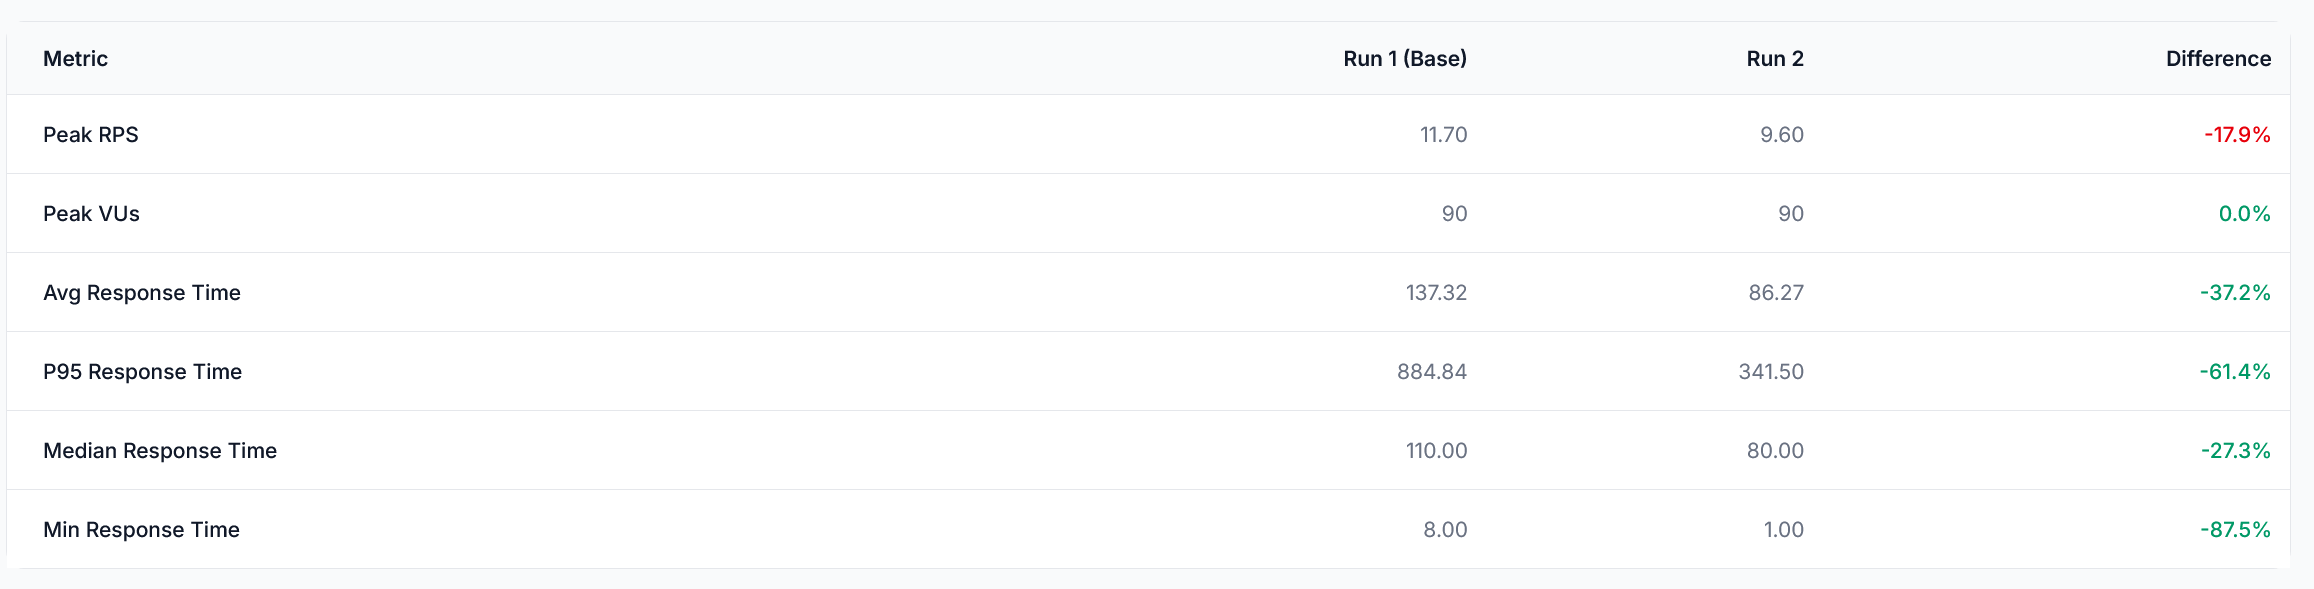 LoadForge also provides a **side-by-side comparison** feature to analyze two test runs in depth. By selecting **"Compare"** on a test run, you can:
* **See key metric differences** (e.g., P95 response time, peak RPS, throughput changes).
* **Analyze response time trends** across both runs.
* **Compare request performance and error rates** to determine if optimizations were successful.
* **View side-by-side execution summaries** to pinpoint where performance improved or worsened.
### Key Metrics in Run Comparison
The comparison table highlights differences in:
* **Peak RPS (Requests Per Second)**
* **Peak Virtual Users (VUs)**
* **Average, P95, and Median Response Times**
* **Error Rate and Total Errors**
* **Peak Throughput**
When comparing runs, focus on the trend lines rather than absolute numbers. A consistent pattern of improvement across multiple metrics is more meaningful than a single dramatic change in one area.
Visualizations such as **response time graphs, request per second trends, and error rates over time** help identify what changed between runs.
A significant **drop in P95 response time** indicates a major performance improvement. Conversely, if P95 increases, investigate bottlenecks.
## When to Compare Runs
Comparing runs is particularly useful when:
* **Optimizing backend performance** (e.g., database queries, caching strategies).
* **Testing infrastructure changes** (e.g., scaling, new servers, load balancing adjustments).
* **Identifying regressions** after a code deployment.
* **Fine-tuning test configurations** to improve accuracy.
By leveraging LoadForge's **test history and comparison tools**, you can continuously optimize your application and ensure it scales effectively under load.
Learn how Apdex scoring measures user satisfaction with performance
Understand how to interpret detailed load test results
LoadForge also provides a **side-by-side comparison** feature to analyze two test runs in depth. By selecting **"Compare"** on a test run, you can:
* **See key metric differences** (e.g., P95 response time, peak RPS, throughput changes).
* **Analyze response time trends** across both runs.
* **Compare request performance and error rates** to determine if optimizations were successful.
* **View side-by-side execution summaries** to pinpoint where performance improved or worsened.
### Key Metrics in Run Comparison
The comparison table highlights differences in:
* **Peak RPS (Requests Per Second)**
* **Peak Virtual Users (VUs)**
* **Average, P95, and Median Response Times**
* **Error Rate and Total Errors**
* **Peak Throughput**
When comparing runs, focus on the trend lines rather than absolute numbers. A consistent pattern of improvement across multiple metrics is more meaningful than a single dramatic change in one area.
Visualizations such as **response time graphs, request per second trends, and error rates over time** help identify what changed between runs.
A significant **drop in P95 response time** indicates a major performance improvement. Conversely, if P95 increases, investigate bottlenecks.
## When to Compare Runs
Comparing runs is particularly useful when:
* **Optimizing backend performance** (e.g., database queries, caching strategies).
* **Testing infrastructure changes** (e.g., scaling, new servers, load balancing adjustments).
* **Identifying regressions** after a code deployment.
* **Fine-tuning test configurations** to improve accuracy.
By leveraging LoadForge's **test history and comparison tools**, you can continuously optimize your application and ensure it scales effectively under load.
Learn how Apdex scoring measures user satisfaction with performance
Understand how to interpret detailed load test results