> ## Documentation Index
> Fetch the complete documentation index at: https://docs.loadforge.com/llms.txt
> Use this file to discover all available pages before exploring further.
# Load Test Results - How to Read & Analyze Performance Data
> A complete guide to interpreting load test results in LoadForge — response times, error rates, percentiles, and actionable optimization tips.
LoadForge provides comprehensive test results to help you analyze load impact, response times, errors, and system health. Let's break down each section of the results page.
## Test Results Overview
Your test results are organized into several key sections that provide different insights into your application's performance.
### Summary Statistics
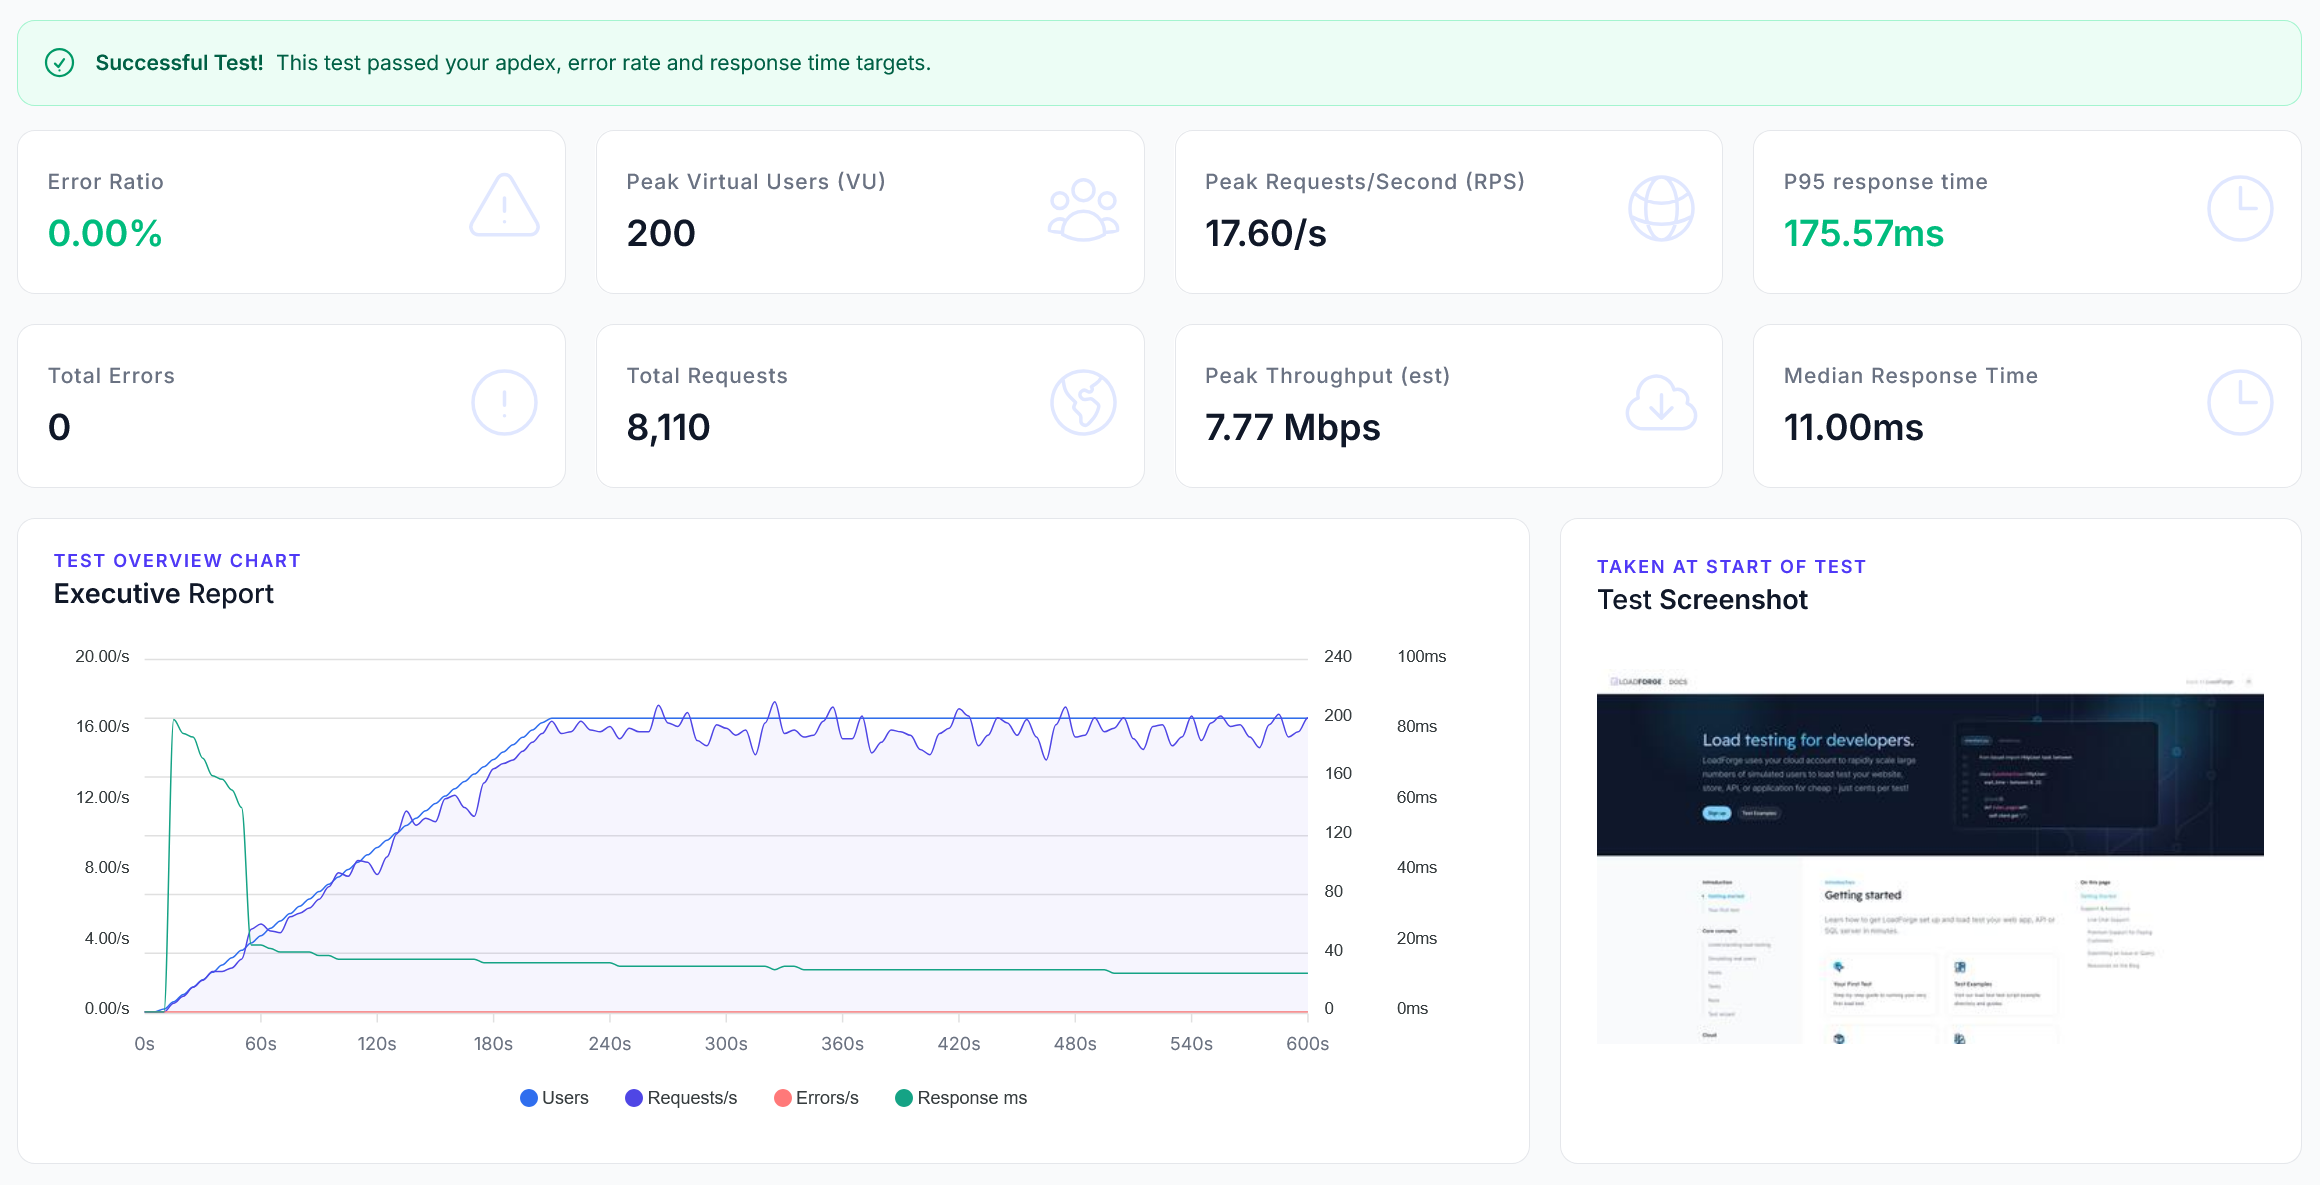 The summary section provides these essential metrics:
* **Test Status**: Pass/Fail based on your defined targets
* **Error Ratio**: Percentage of failed requests
* **Peak VUs**: Maximum concurrent users during the test
* **Peak RPS**: Highest requests per second achieved
* **Throughput**: Total data transferred per second
* **Response Times**: P95 and median measurements
* **Visual Capture**: Screenshot of your site during testing
When reviewing summary statistics, pay special attention to the Error Ratio. Even a small percentage of errors can indicate significant issues under load.
### Response Time Analysis
The summary section provides these essential metrics:
* **Test Status**: Pass/Fail based on your defined targets
* **Error Ratio**: Percentage of failed requests
* **Peak VUs**: Maximum concurrent users during the test
* **Peak RPS**: Highest requests per second achieved
* **Throughput**: Total data transferred per second
* **Response Times**: P95 and median measurements
* **Visual Capture**: Screenshot of your site during testing
When reviewing summary statistics, pay special attention to the Error Ratio. Even a small percentage of errors can indicate significant issues under load.
### Response Time Analysis
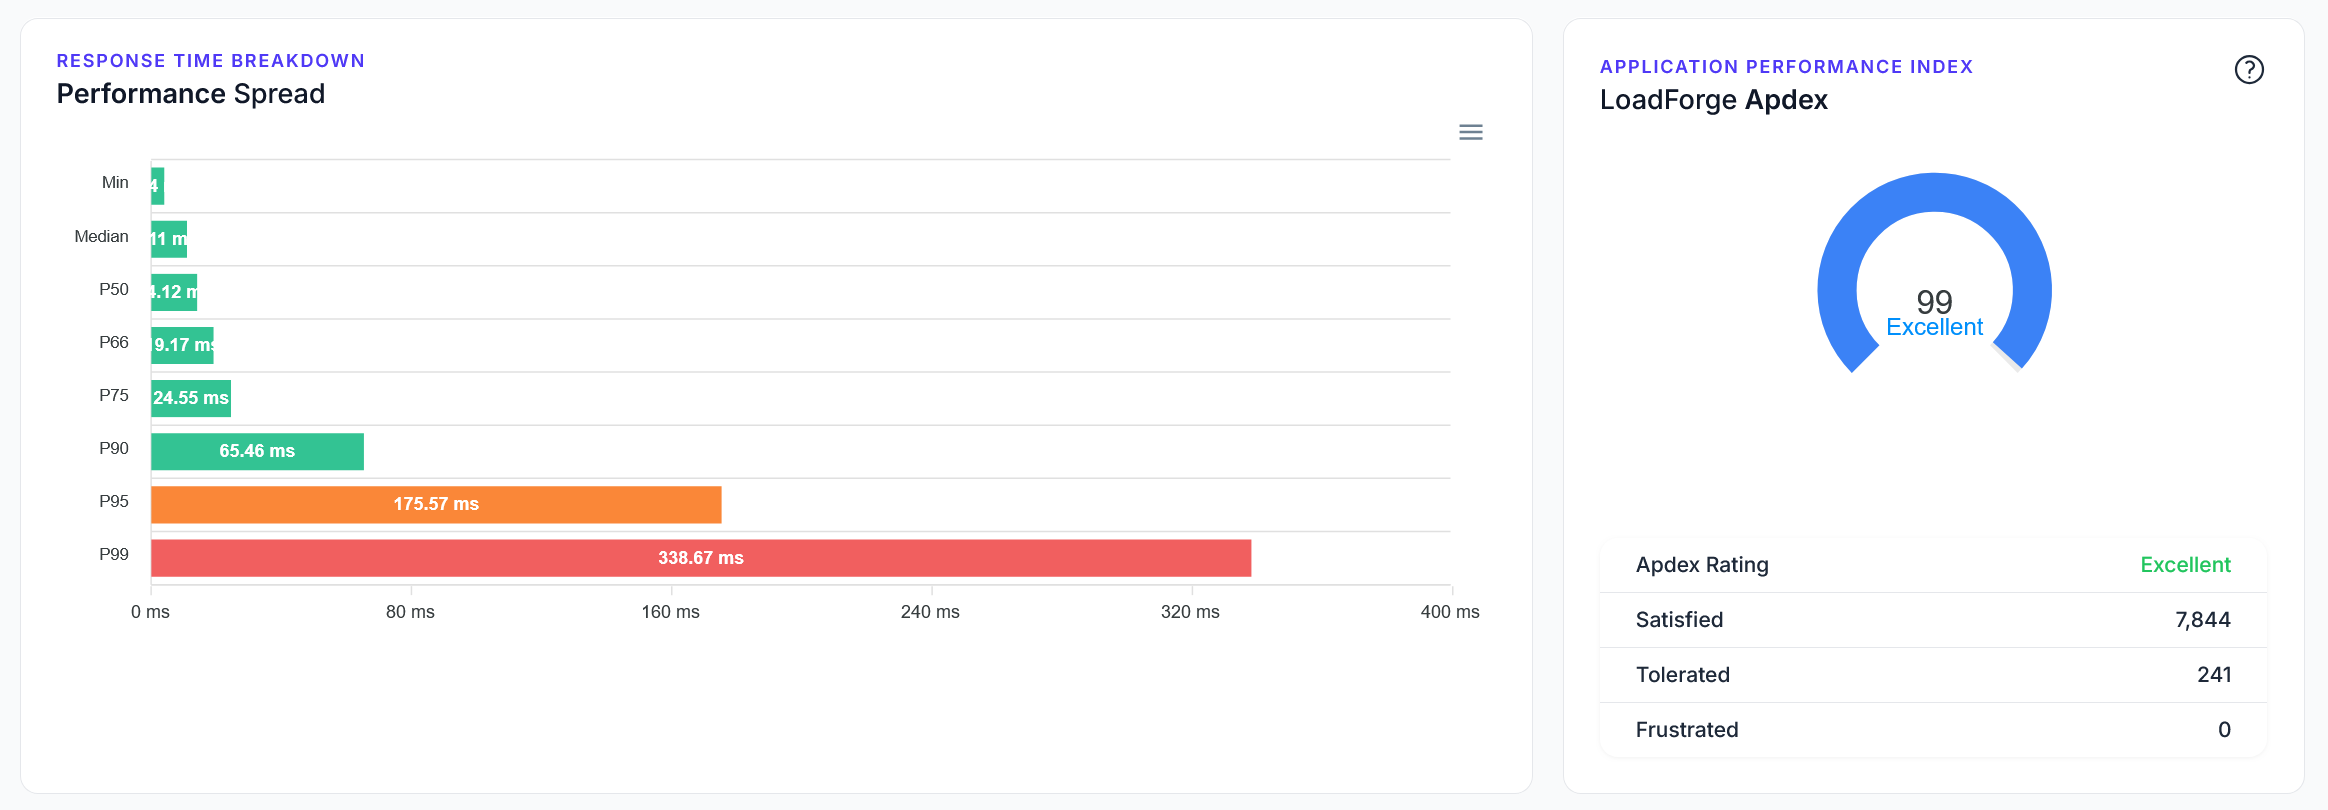 Response times are broken down into percentiles:
* **P50 (Median)**: Typical user experience
* **P75**: Upper quarter of response times
* **P95**: Slowest 5% of responses
* **P99**: Edge cases and worst performance
Watch for large gaps between percentiles. If P95 is significantly higher than P50, it indicates inconsistent performance that could frustrate users.
## Performance Metrics
### Apdex Scoring
The Apdex score measures user satisfaction with three categories:
* **Satisfied**: Requests within target time
* **Tolerated**: Slower but acceptable responses
* **Frustrated**: Requests exceeding thresholds
Target an Apdex score of 0.85 or higher for optimal user experience. Scores below 0.7 indicate serious performance issues.
### Page-Level Performance
Response times are broken down into percentiles:
* **P50 (Median)**: Typical user experience
* **P75**: Upper quarter of response times
* **P95**: Slowest 5% of responses
* **P99**: Edge cases and worst performance
Watch for large gaps between percentiles. If P95 is significantly higher than P50, it indicates inconsistent performance that could frustrate users.
## Performance Metrics
### Apdex Scoring
The Apdex score measures user satisfaction with three categories:
* **Satisfied**: Requests within target time
* **Tolerated**: Slower but acceptable responses
* **Frustrated**: Requests exceeding thresholds
Target an Apdex score of 0.85 or higher for optimal user experience. Scores below 0.7 indicate serious performance issues.
### Page-Level Performance
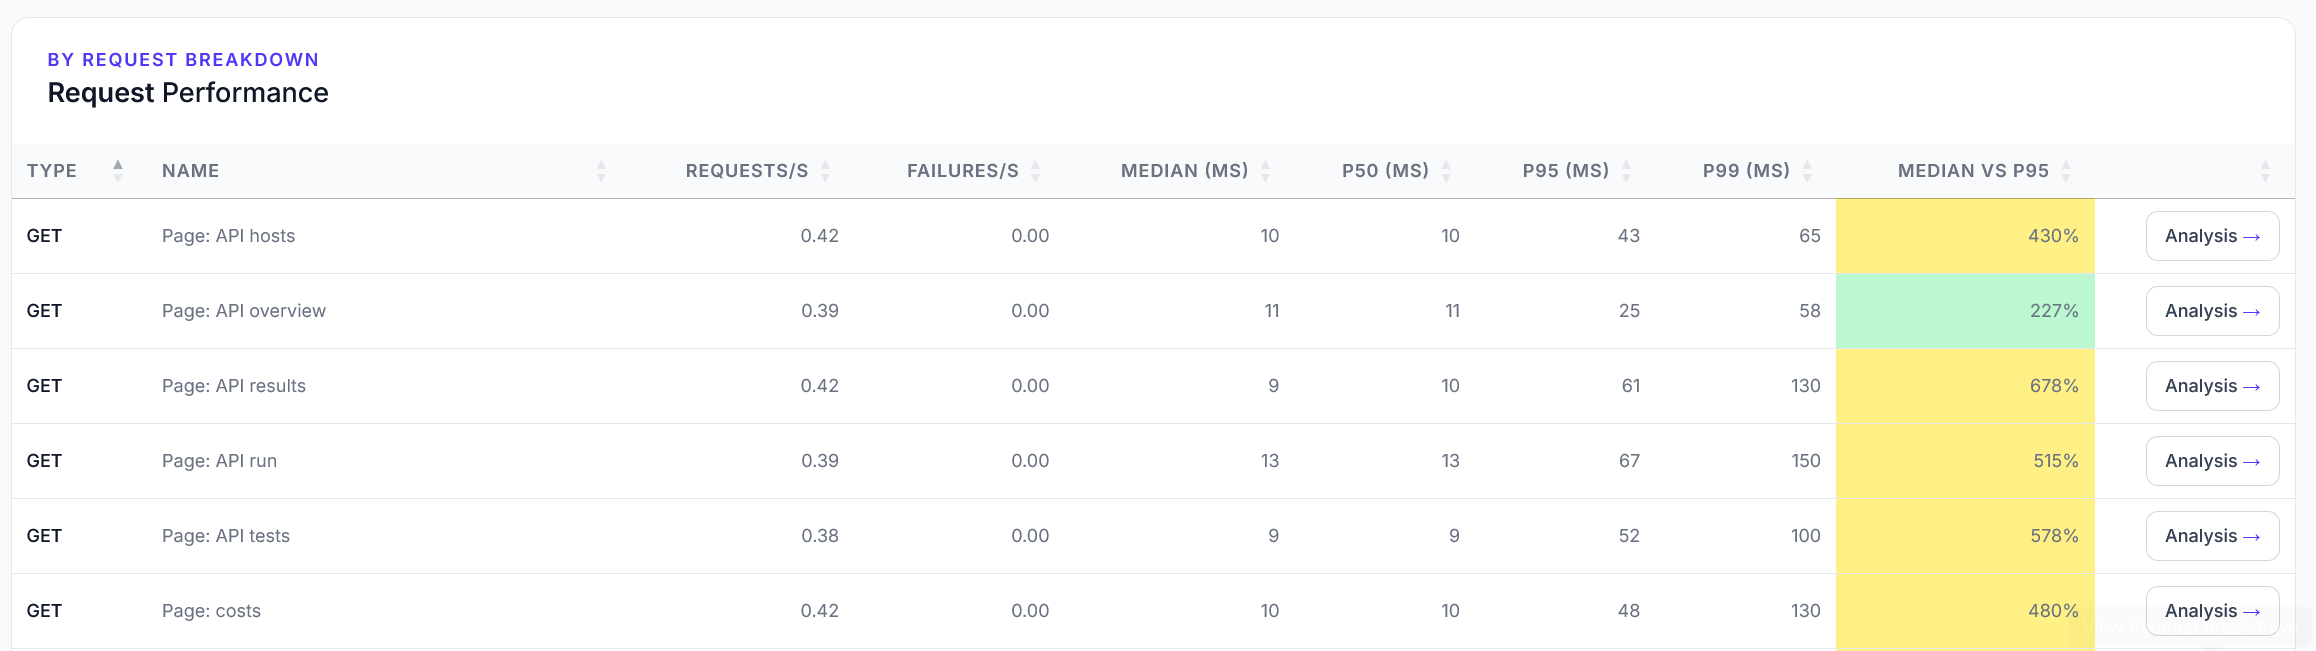 Each page or endpoint shows:
* **Request Count**: Total number of hits
* **Success/Failure Rate**: Reliability metrics
* **Response Time Distribution**: Median and P95 times
* **Performance Variance**: Consistency indicators
Sort by P95 response time to quickly identify your slowest endpoints. These are often the best candidates for optimization.
## Load Analysis
### Request Rate Trends
The request rate graph shows:
* **Load Distribution**: How requests varied over time
* **Ramp-up Patterns**: Load increase characteristics
* **Potential Issues**: Sudden drops or spikes
Sharp drops in request rate often indicate system failure under load. Look for corresponding error spikes at these points.
### Error Analysis
When errors occur, you'll see:
* **Error Types**: Categorized by HTTP status (4xx, 5xx)
* **Failure Patterns**: Common error scenarios
* **Timing Data**: When errors occurred during the test
## Optimization Guide
### Common Issues and Solutions
* Optimize database queries
* Implement caching
* Review server resources
* Check for N+1 queries
* Scale infrastructure
* Adjust rate limits
* Optimize background jobs
* Review error handling
* Verify target thresholds
* Implement CDN
* Optimize static assets
* Review server-side rendering
### Performance Improvement Steps
1. **Identify Bottlenecks**
* Review slowest endpoints
* Analyze error patterns
* Check resource utilization
2. **Implement Solutions**
* Apply caching strategies
* Optimize database queries
* Scale infrastructure
3. **Verify Improvements**
* Run comparison tests
* Monitor metrics
* Review Apdex trends
Follow the 80/20 rule: Focus on optimizing the slowest 20% of endpoints first, as this often improves 80% of user experience.
## Next Steps
Track improvements and identify regressions across different test runs
Deep dive into Apdex scoring and performance satisfaction metrics
Remember to save your test results for historical comparison. This helps track improvements and identify performance regressions over time.
Each page or endpoint shows:
* **Request Count**: Total number of hits
* **Success/Failure Rate**: Reliability metrics
* **Response Time Distribution**: Median and P95 times
* **Performance Variance**: Consistency indicators
Sort by P95 response time to quickly identify your slowest endpoints. These are often the best candidates for optimization.
## Load Analysis
### Request Rate Trends
The request rate graph shows:
* **Load Distribution**: How requests varied over time
* **Ramp-up Patterns**: Load increase characteristics
* **Potential Issues**: Sudden drops or spikes
Sharp drops in request rate often indicate system failure under load. Look for corresponding error spikes at these points.
### Error Analysis
When errors occur, you'll see:
* **Error Types**: Categorized by HTTP status (4xx, 5xx)
* **Failure Patterns**: Common error scenarios
* **Timing Data**: When errors occurred during the test
## Optimization Guide
### Common Issues and Solutions
* Optimize database queries
* Implement caching
* Review server resources
* Check for N+1 queries
* Scale infrastructure
* Adjust rate limits
* Optimize background jobs
* Review error handling
* Verify target thresholds
* Implement CDN
* Optimize static assets
* Review server-side rendering
### Performance Improvement Steps
1. **Identify Bottlenecks**
* Review slowest endpoints
* Analyze error patterns
* Check resource utilization
2. **Implement Solutions**
* Apply caching strategies
* Optimize database queries
* Scale infrastructure
3. **Verify Improvements**
* Run comparison tests
* Monitor metrics
* Review Apdex trends
Follow the 80/20 rule: Focus on optimizing the slowest 20% of endpoints first, as this often improves 80% of user experience.
## Next Steps
Track improvements and identify regressions across different test runs
Deep dive into Apdex scoring and performance satisfaction metrics
Remember to save your test results for historical comparison. This helps track improvements and identify performance regressions over time.