Host Response Times Monitoring
Real-Time Alerts
LoadForge provides real-time alerts if your host becomes unresponsive or suffers a significant performance drop. By default, notifications are sent via email, but you can also configure alerts through Slack or Zapier for better integration with your team’s workflow.Tracking Performance Metrics
In addition to uptime monitoring, LoadForge tracks your host’s response times and performance trends, helping you identify potential slowdowns before they impact users.TTFB Measurement
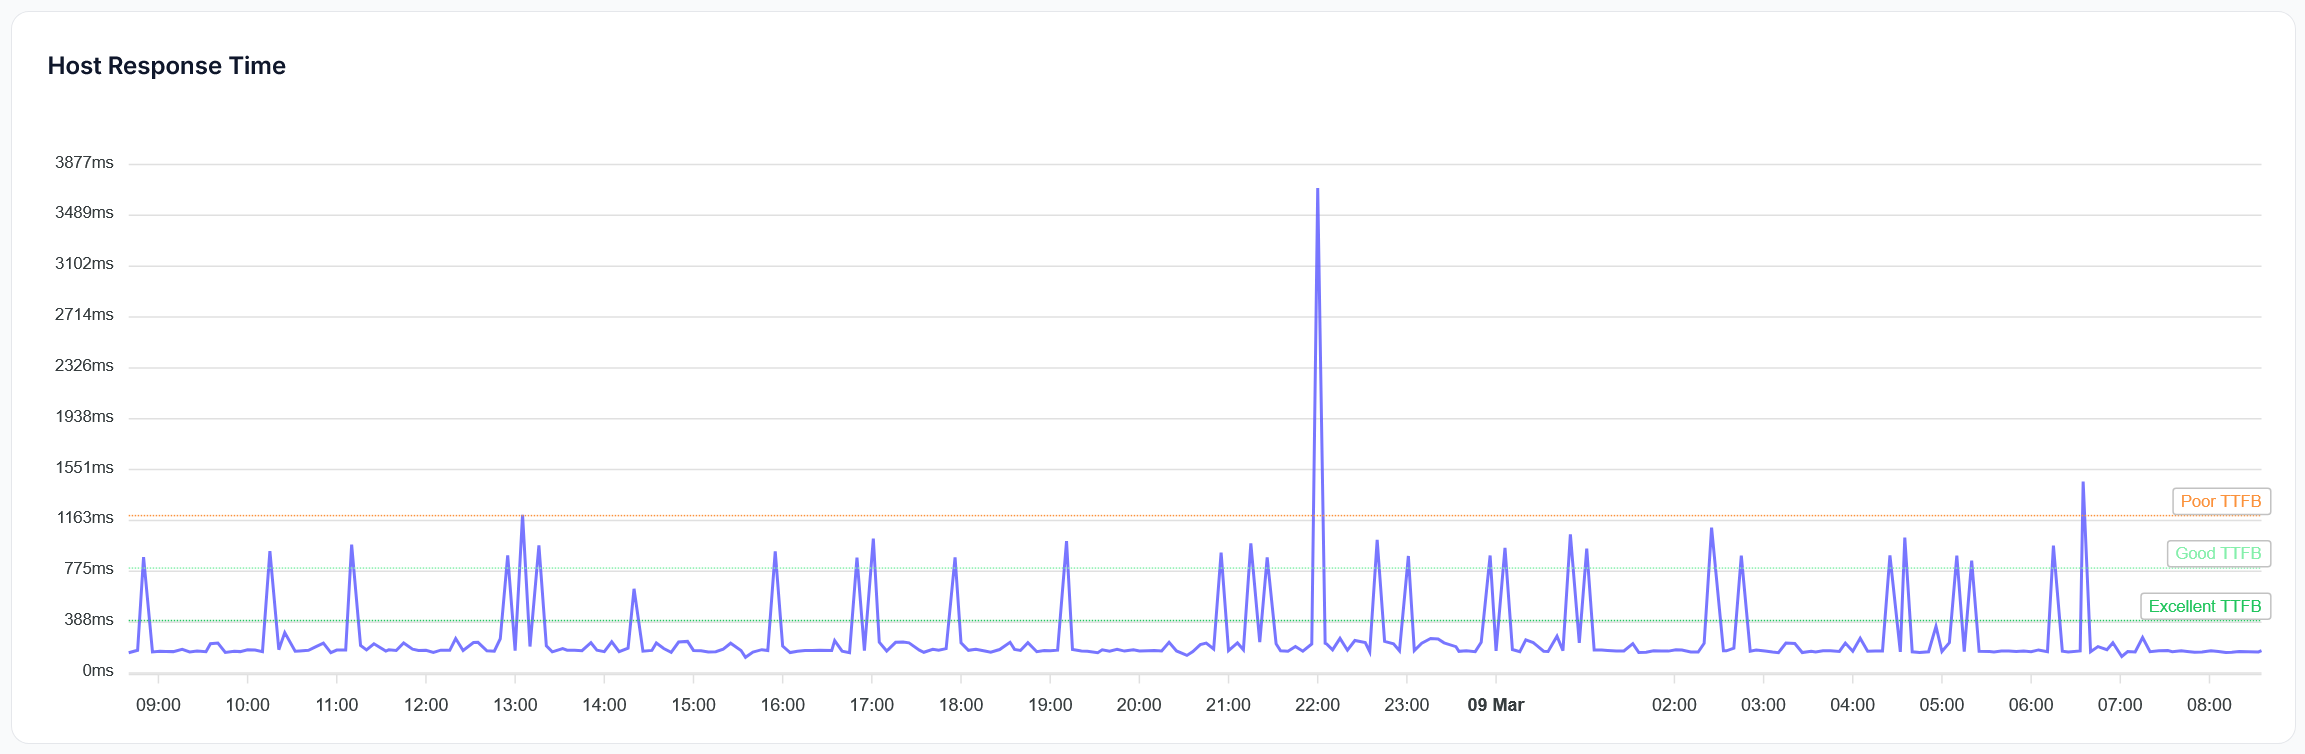
We measure the Time to First Byte (TTFB) of your web server. This metric, which indicates how long a user must wait before your backend starts responding, is crucial for assessing the responsiveness of your website or application. TTFB results can also be viewed in more detail on the User Experience page, providing insights into how backend performance affects user experience.Historical Data & Trend Analysis
LoadForge retains historical response time data, enabling you to:- Detect long-term performance trends.
- Identify gradual slowdowns that may indicate infrastructure issues.
- Compare performance before and after deployments.
Percentile Distribution
LoadForge groups your response times into two distribution charts. The first categorizes performance into different response brackets, from Excellent to Poor. This helps you quickly assess how your host is performing for the majority of users. The second chart displays response time variation by time of day, allowing you to detect peak load times that may be slowing down your servers. Identifying these trends can help you adjust your infrastructure to better handle traffic fluctuations.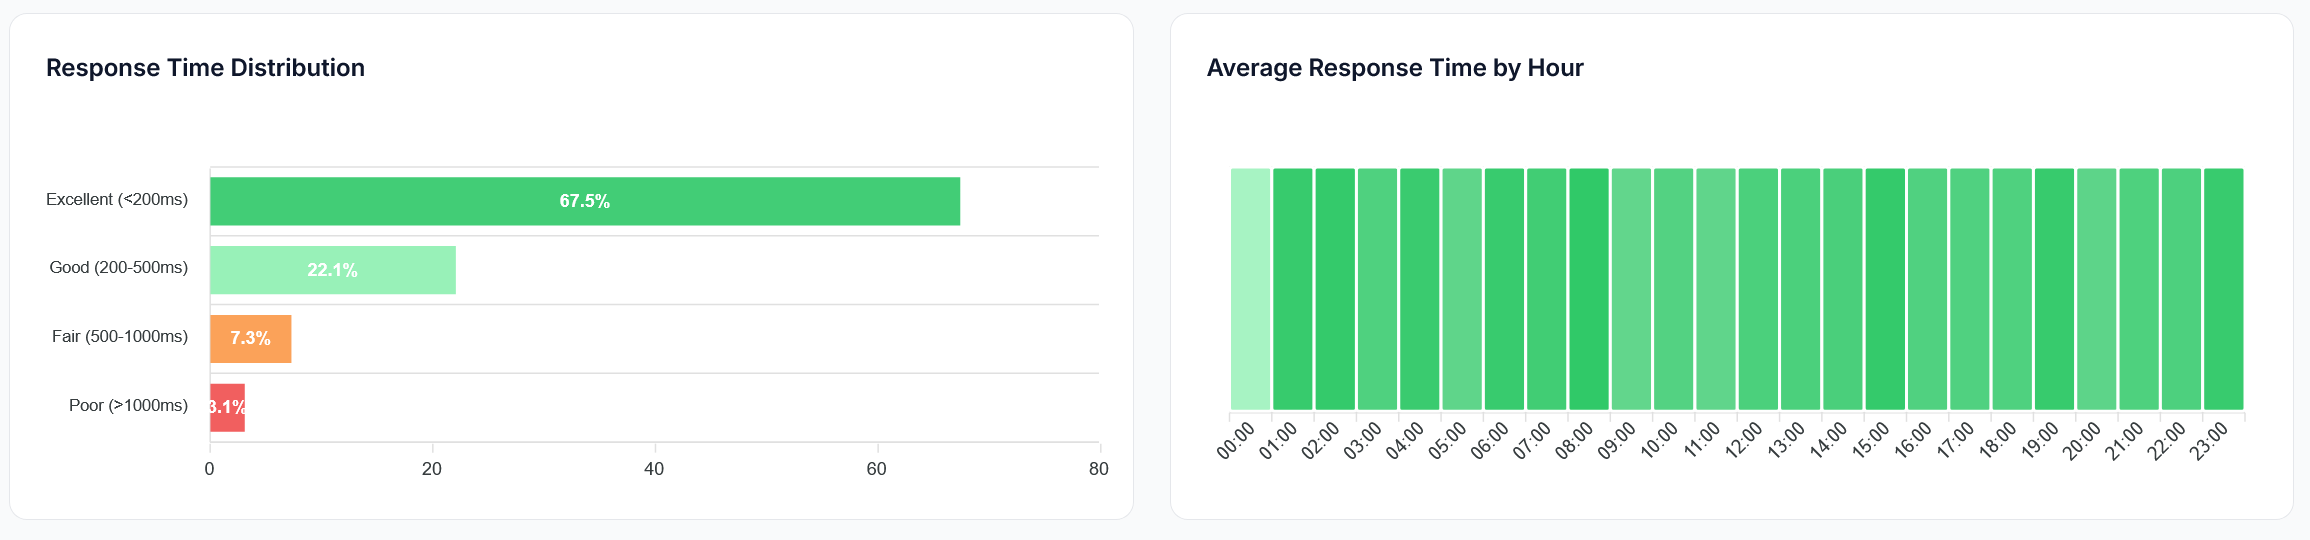
Host Response Time Percentile Distribution
Response Time Ratings
Our rating system for user experience on TTFB is as follows:- Excellent: Under 200ms
- Good: 200-500ms
- Fair: 500-1000ms
- Poor: Anything over 1000ms
Performance Monitoring
Explore our comprehensive performance monitoring suite
LoadForge Score
Understand your site’s overall performance rating
Response time monitoring is now part of our new Performance Monitoring section. For detailed analysis, visit the Response Times & Uptime page.