How It Works
LoadForge checks the health of your host every 5 minutes and records detailed response time metrics. This data is analyzed to provide both real-time alerts and historical performance trends.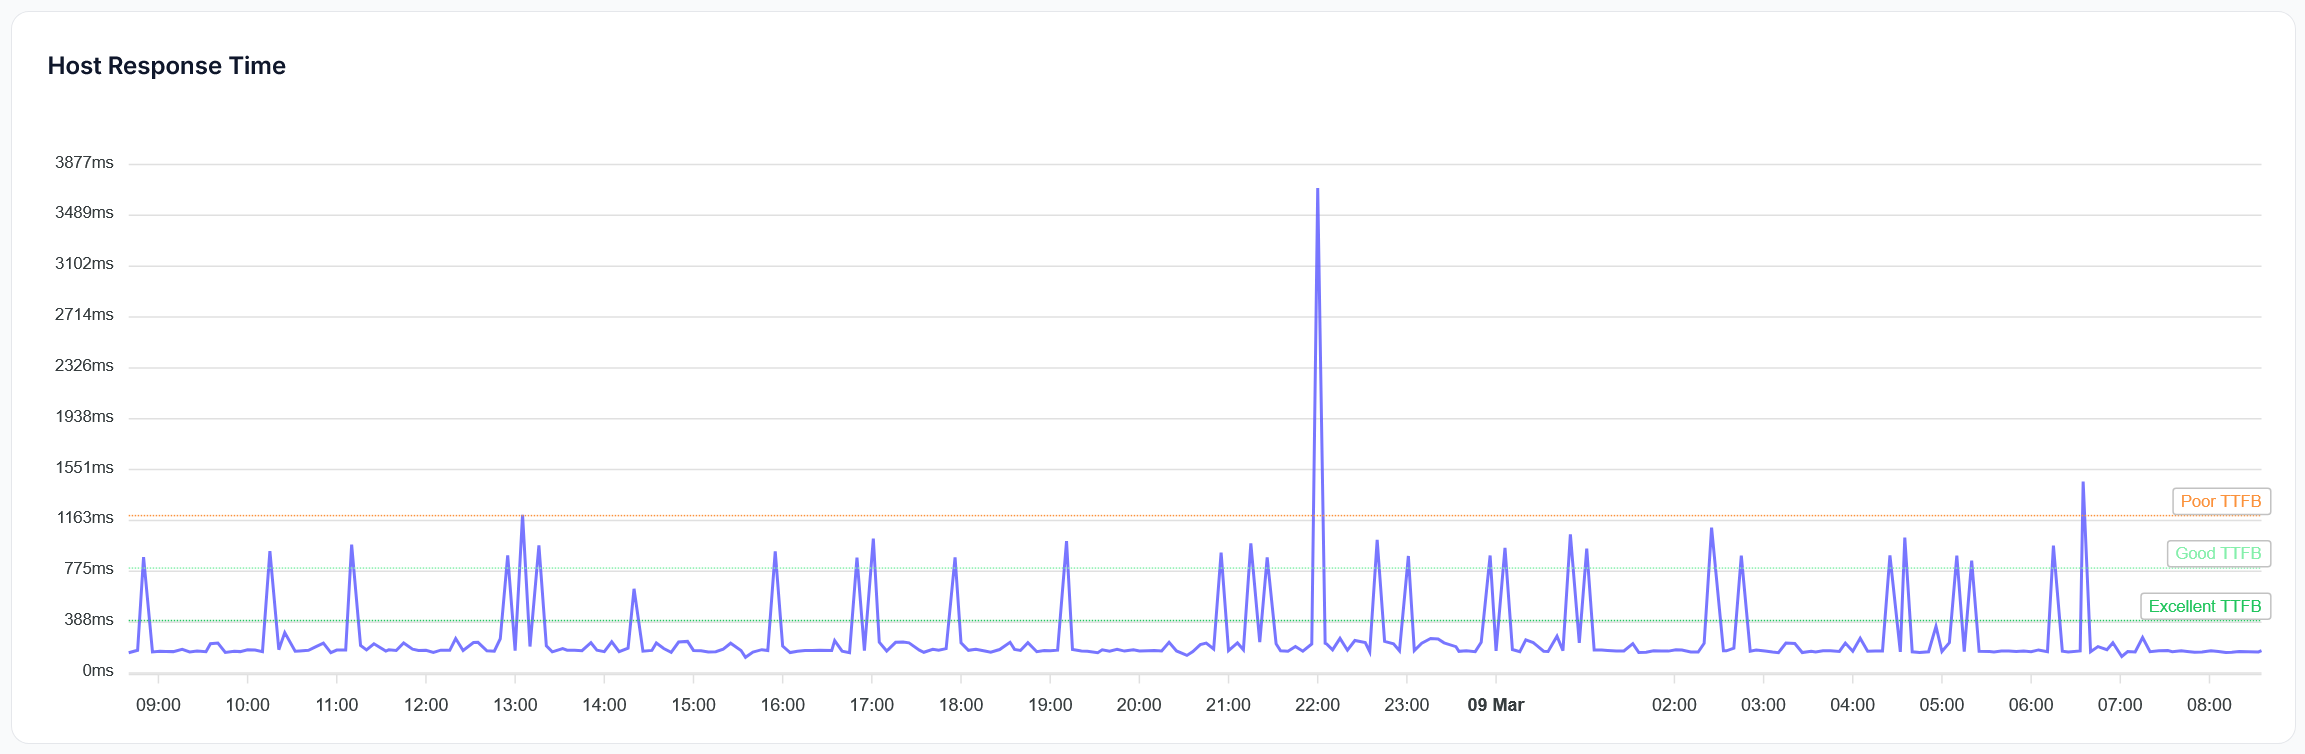
Key Metrics
Response Time
Response time measures how quickly your server responds to requests, directly impacting user experience and satisfaction. LoadForge tracks:- Average Response Time: The mean time it takes for your server to respond to requests
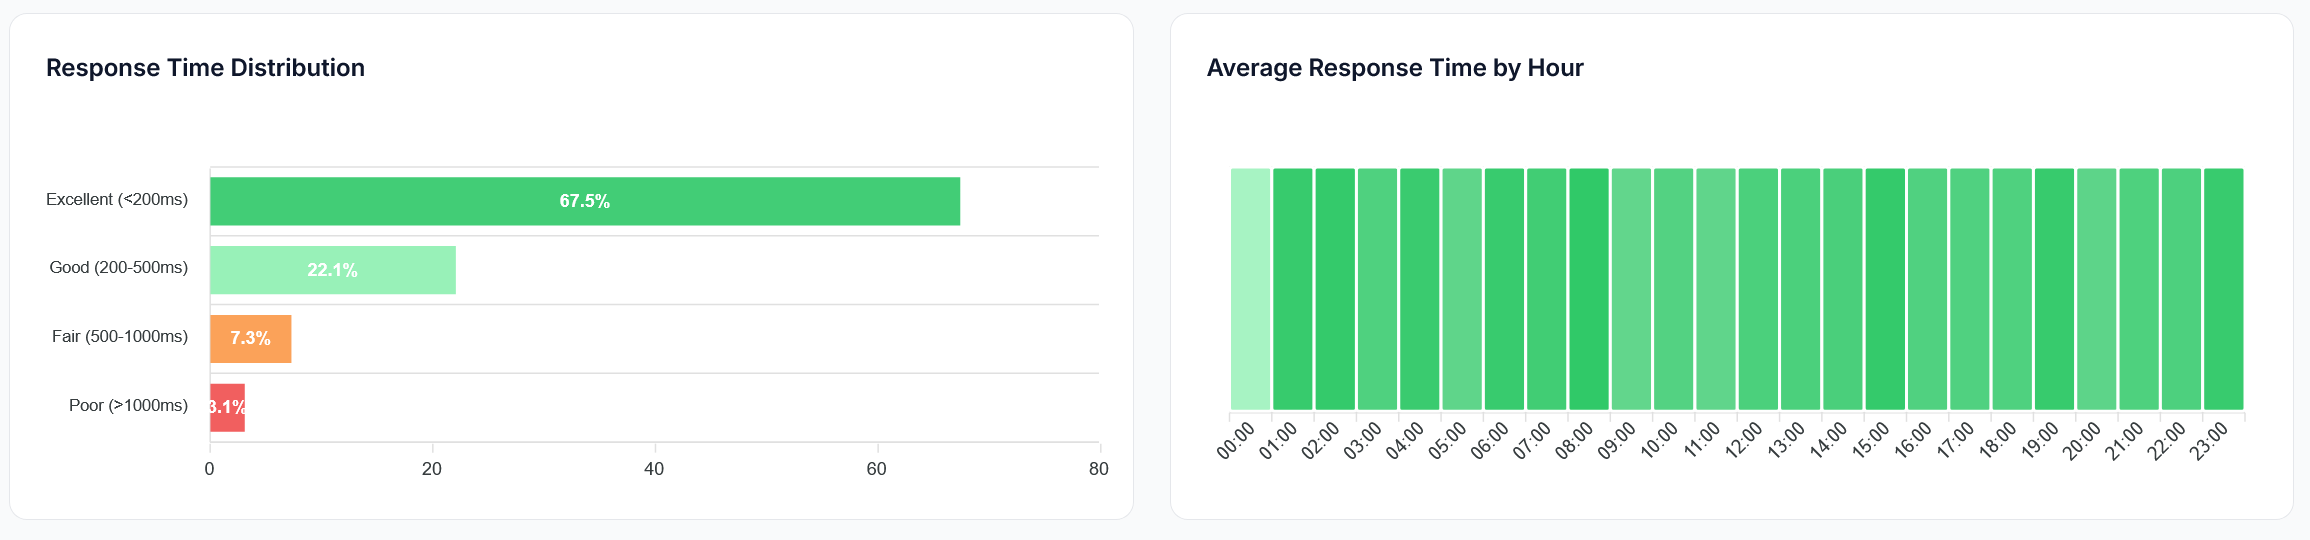
- Response Time Distribution: How response times vary across different percentiles
- Time-of-Day Patterns: Identifying peak load times that may affect performance
Uptime
Uptime monitoring tracks the availability of your service, ensuring that your application remains accessible to users. LoadForge provides:- Real-Time Status: Immediate notification if your service becomes unavailable
- Uptime Percentage: Historical record of your service’s reliability
- Downtime Analysis: Insights into patterns or causes of service interruptions
Response Time Ratings
LoadForge categorizes response times into performance brackets to help you quickly assess your server’s performance:Excellent
Under 200ms
Good
200-500ms
Fair
500-1000ms
Poor
Over 1000ms
Percentile Distribution
LoadForge provides two key distribution charts to help you understand your response time patterns:- Performance Brackets: Shows what percentage of responses fall into each performance category
- Time-of-Day Variation: Identifies peak load times that may be affecting performance
Alerts & Notifications
LoadForge provides real-time alerts when your host:- Becomes unresponsive
- Experiences a significant performance drop
- Shows a pattern of degrading response times
- Email (default)
- Slack integration
- Zapier webhooks
Historical Analysis
Historical response time data allows you to:- Track long-term performance trends
- Identify gradual slowdowns before they become critical
- Compare performance before and after infrastructure changes
- Correlate response time issues with specific events or changes
Impact on LoadForge Score
Response time metrics account for 30% of your overall LoadForge Score, making them a critical component of your site’s performance rating.Core Web Vitals
Learn about real user experience metrics
Lighthouse
Discover technical performance insights