About CrUX
The Chrome User Experience Report (CrUX) collects anonymized, real-world performance data from Chrome users visiting your website. This dataset provides insights into how real users experience your site, highlighting potential bottlenecks and areas for improvement.HTTP/S Performance Metrics
For HTTP/S performance, we primarily focus on TTFB (Time to First Byte) and FCP (First Contentful Paint). These metrics measure how quickly your site starts displaying content to users and are directly tied to the performance of your backend infrastructure.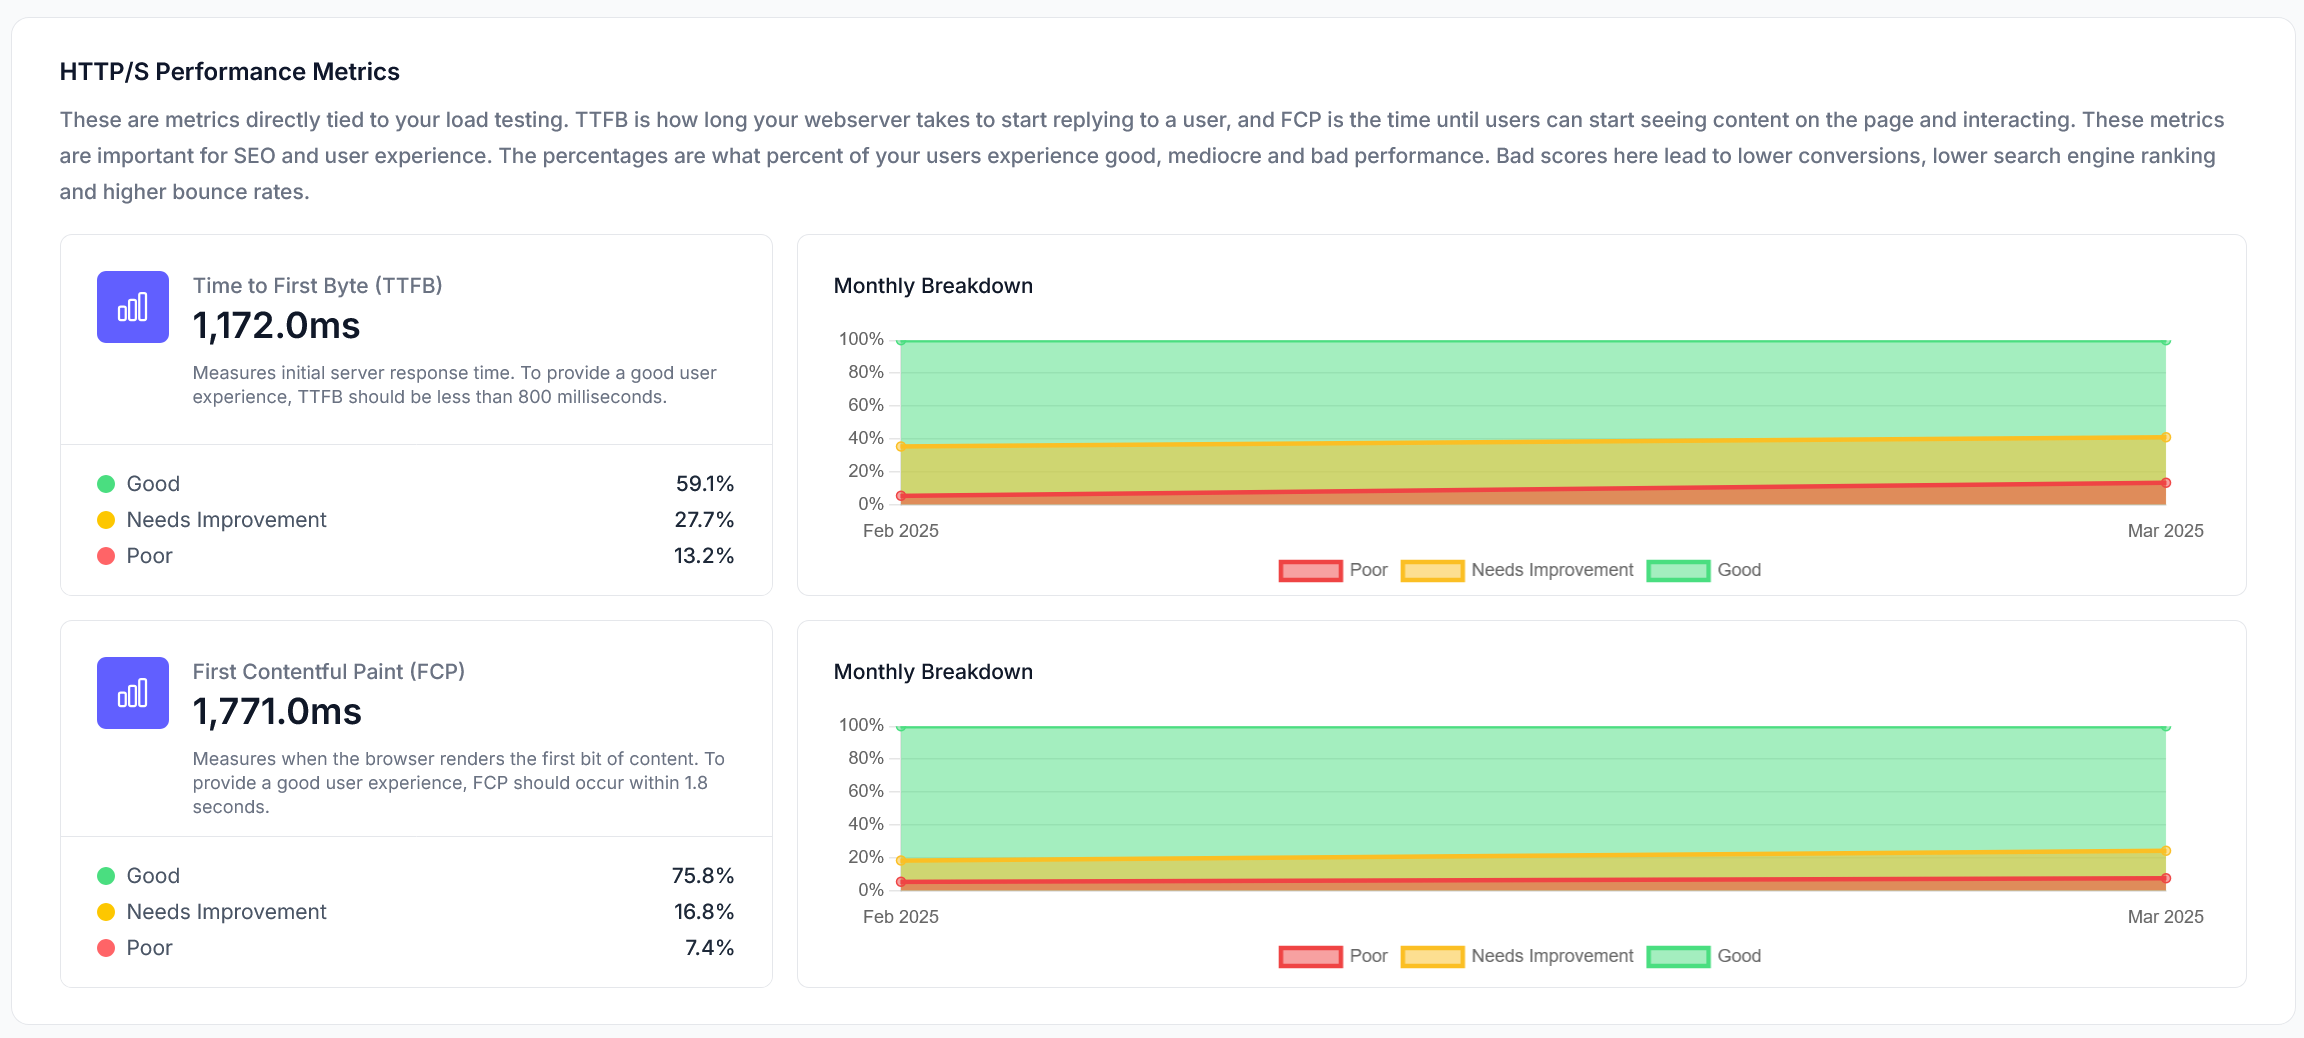
HTTP/S Performance Metrics
- TTFB (Time to First Byte): Measures the delay before a user receives the first byte from your server.
- FCP (First Contentful Paint): Indicates when the first visible element of your site appears to users.
Web Performance Metrics
Web performance metrics relate to the front-end experience of your site, including layout shifts, interaction delays, and overall smoothness. These factors influence how snappy and fluid your website feels after it has loaded.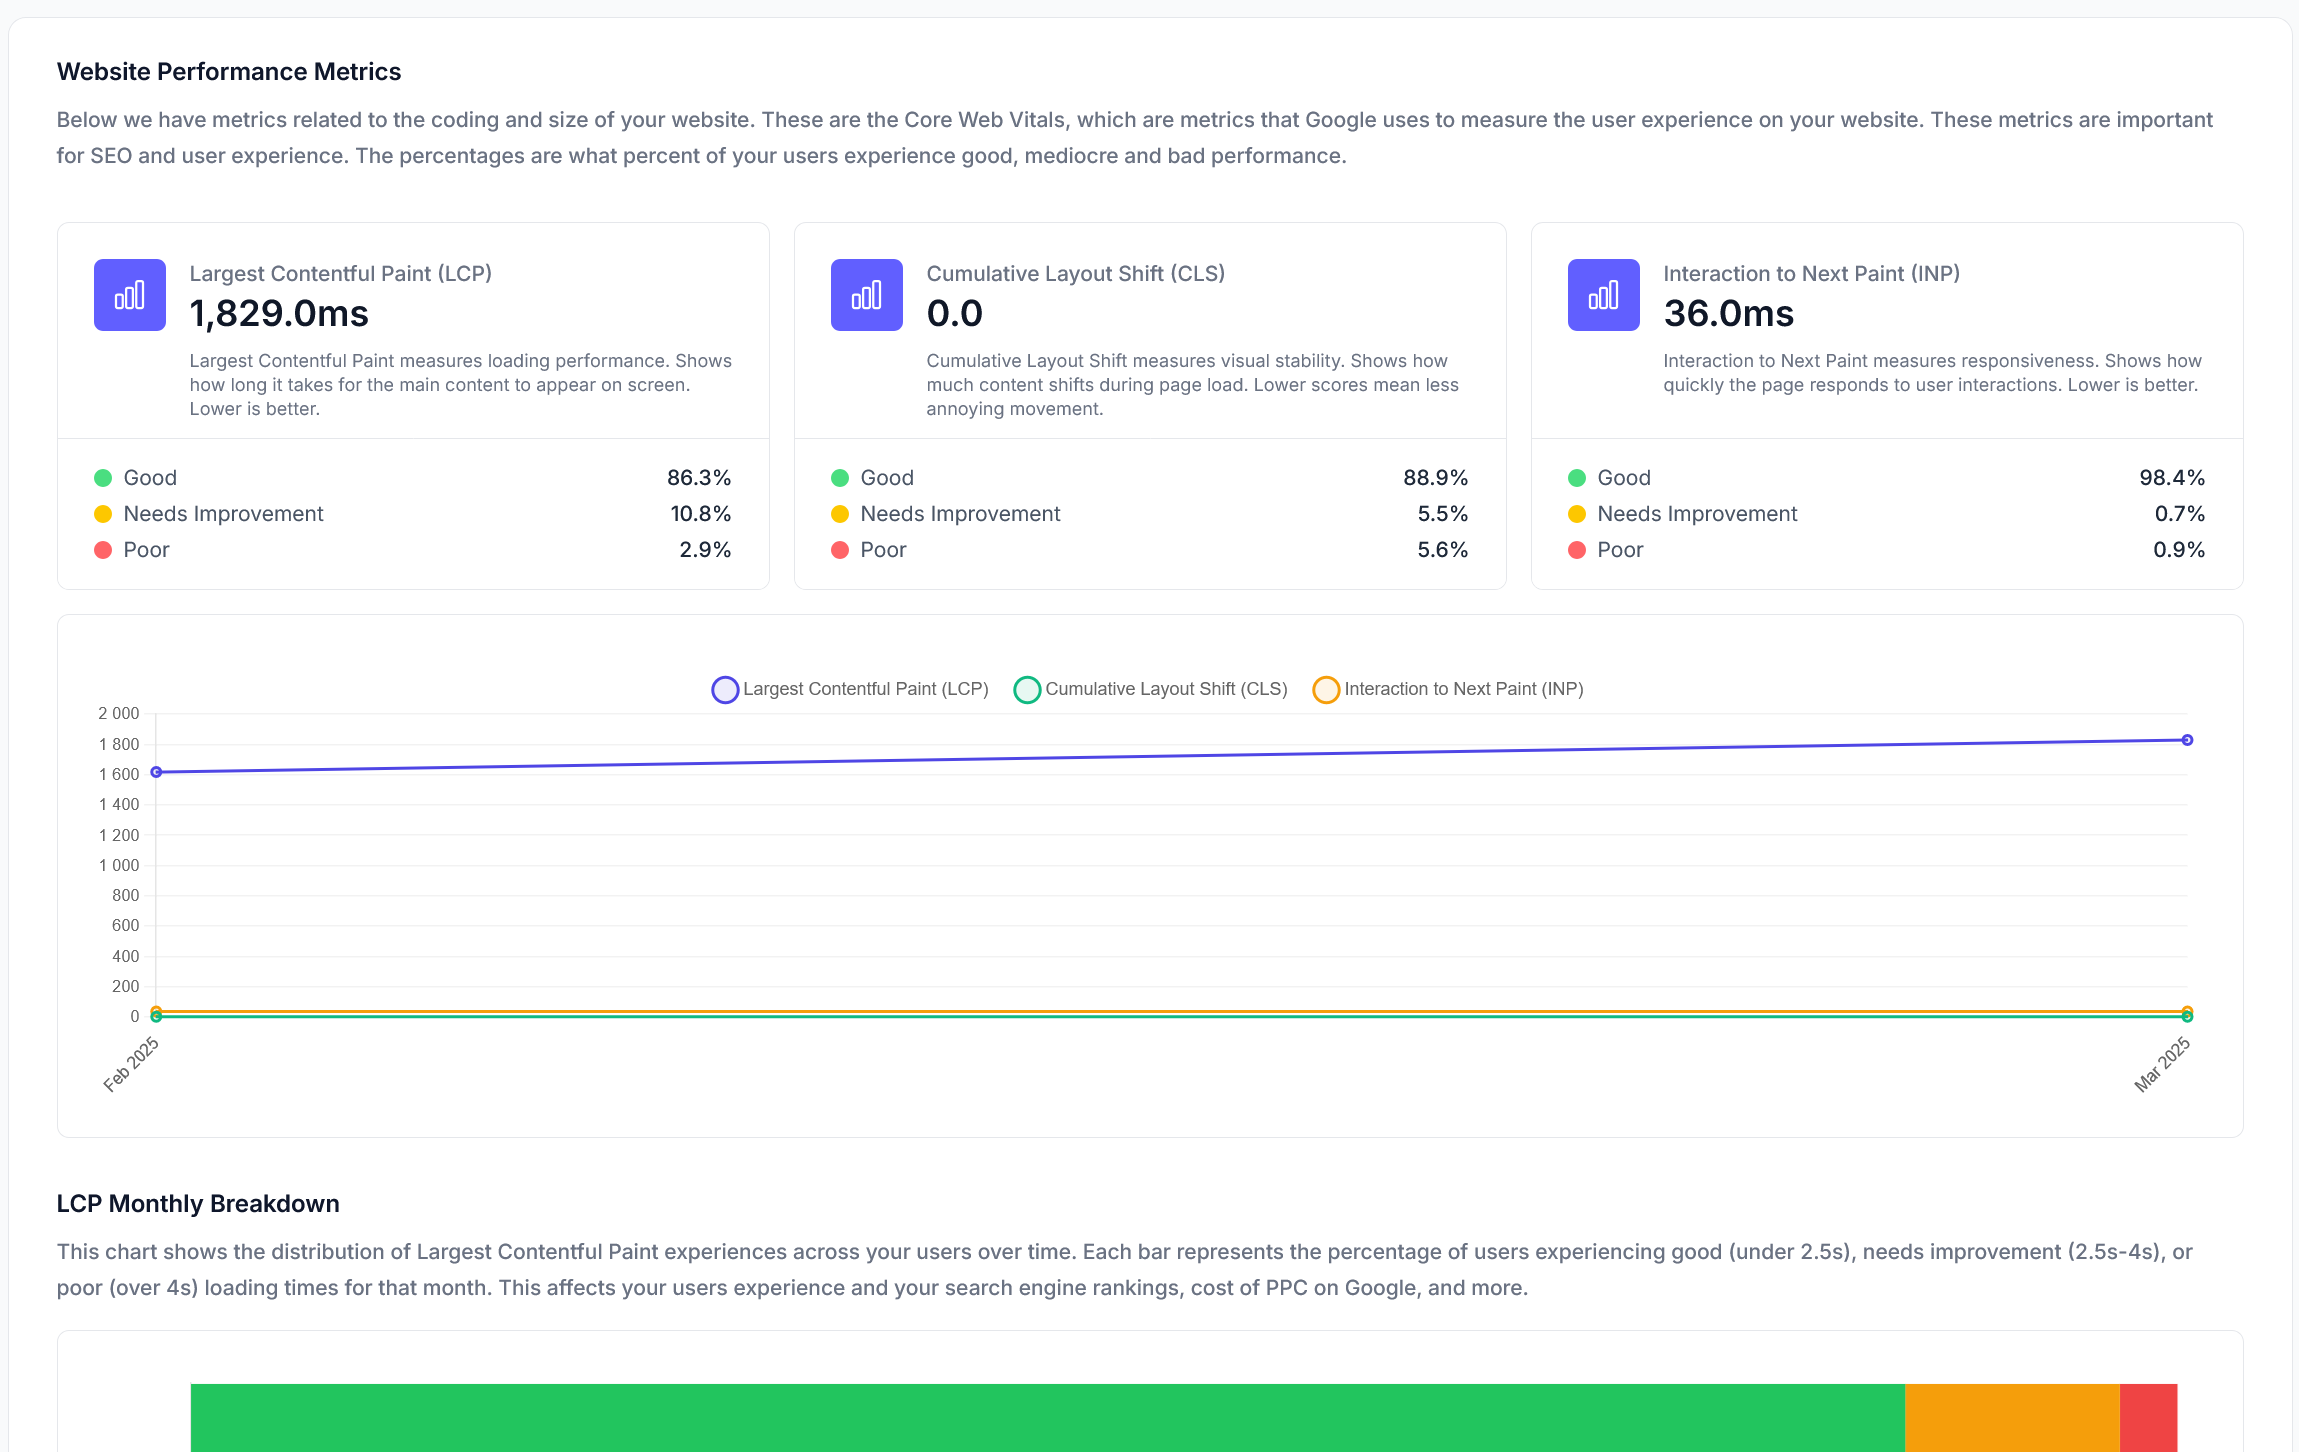
Web Performance Metrics
- CLS (Cumulative Layout Shift): Measures unexpected page movement, which can be frustrating for users.
- INP (Interaction to Next Paint): Evaluates responsiveness by measuring interaction delays.
- LCP (Largest Contentful Paint): Tracks the loading time of the largest visible element.
Graphing Over Time
LoadForge stores and tracks these results each month, allowing you to monitor real user experience trends over time. This enables you to:- Compare performance improvements after optimization efforts.
- Identify seasonal traffic changes that may impact performance.
- Detect regressions after updates or infrastructure changes.
Why These Metrics Matter
These performance indicators are crucial for both SEO rankings and user experience.- SEO Impact: Google prioritizes fast, user-friendly websites in search rankings. Poor performance can lower your visibility in search results.
- User Experience: A faster, more responsive website leads to higher engagement, lower bounce rates, and increased conversions.
Uptime & Response Monitoring
Learn how LoadForge monitors your host’s uptime and response times
Performance Monitoring
Explore our comprehensive performance monitoring suite
CrUX metrics are now part of our new Performance Monitoring section. For detailed CrUX analysis, visit the Core Web Vitals page.