- Runs Per Test View: View all historical runs of a test in one place.
- Compare View: Directly compare two test runs side by side.
Runs Per Test View
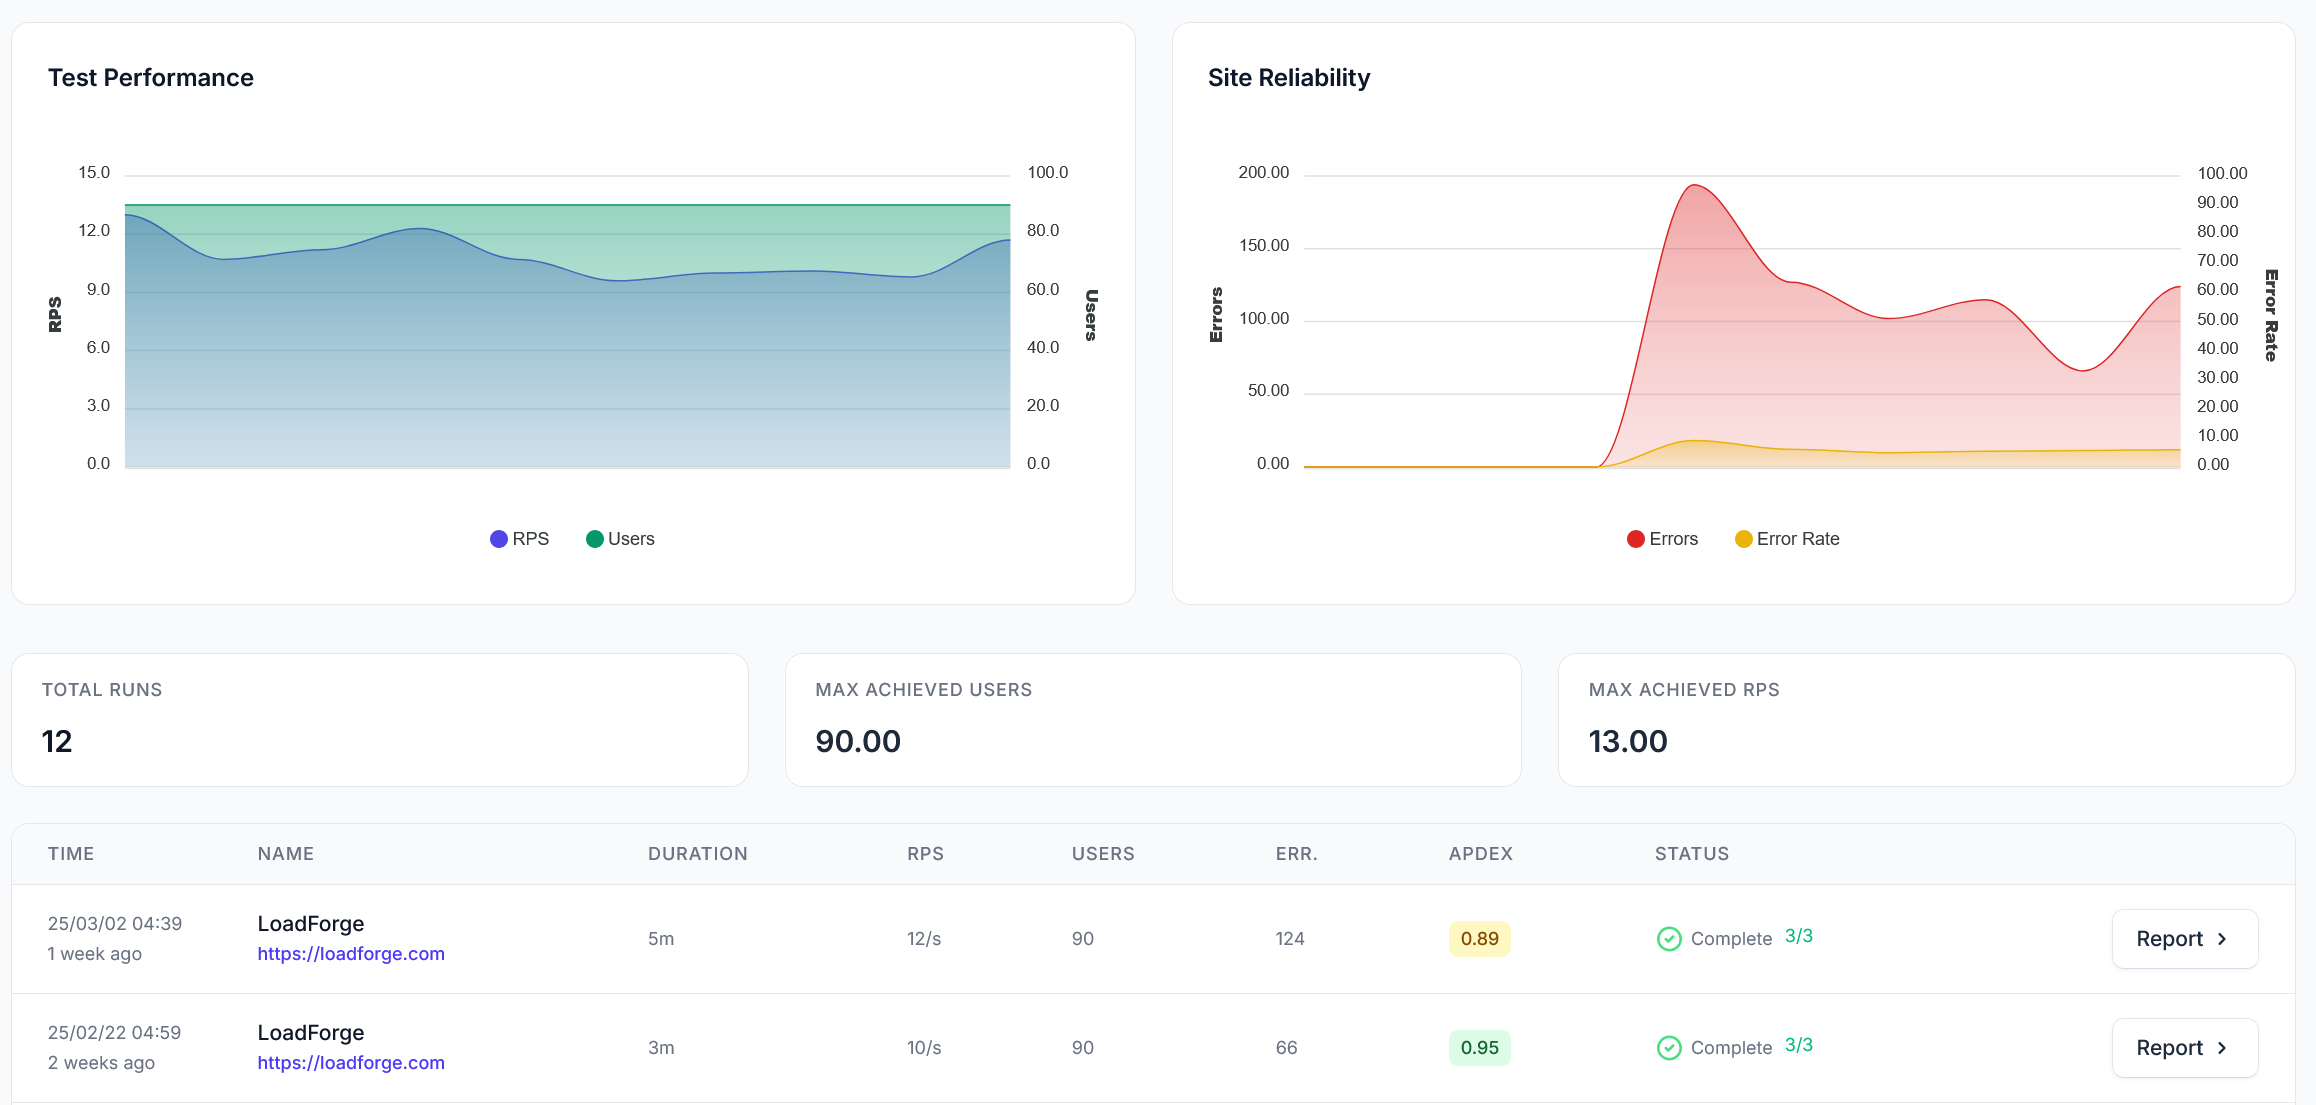
Runs Per Test View
- See all historical runs for a particular test.
- Track trends in performance, Apdex scores, error rates, and response times.
- Identify how your application behaves under load over time.
Compare View
Side-by-Side Run Comparison
- See key metric differences (e.g., P95 response time, peak RPS, throughput changes).
- Analyze response time trends across both runs.
- Compare request performance and error rates to determine if optimizations were successful.
- View side-by-side execution summaries to pinpoint where performance improved or worsened.
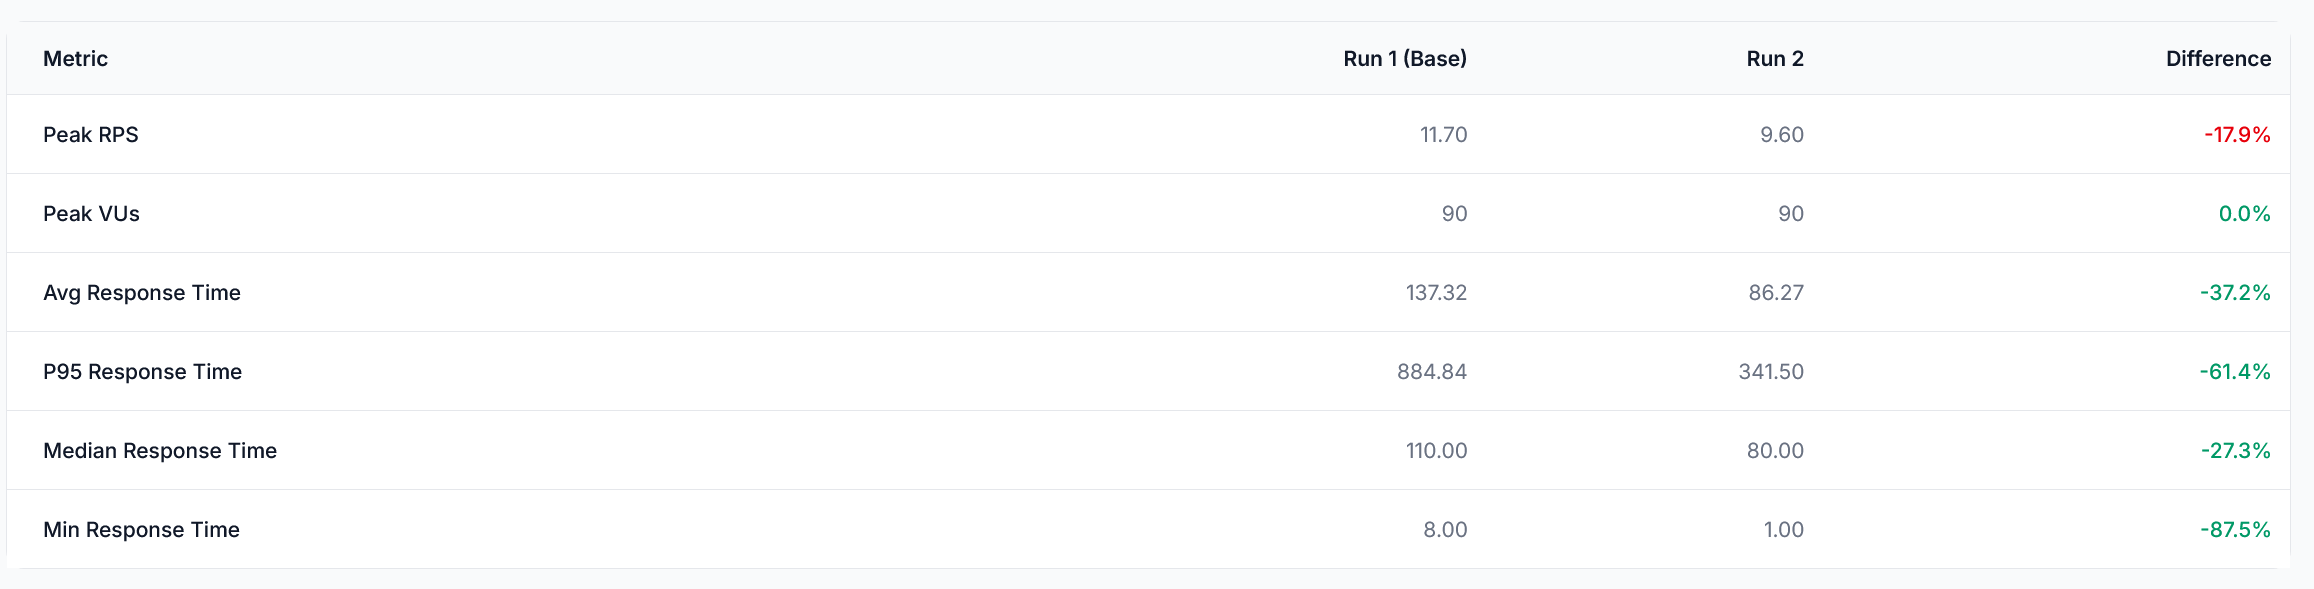
Key Metrics in Run Comparison
The comparison table highlights differences in:- Peak RPS (Requests Per Second)
- Peak Virtual Users (VUs)
- Average, P95, and Median Response Times
- Error Rate and Total Errors
- Peak Throughput
When to Compare Runs
Comparing runs is particularly useful when:- Optimizing backend performance (e.g., database queries, caching strategies).
- Testing infrastructure changes (e.g., scaling, new servers, load balancing adjustments).
- Identifying regressions after a code deployment.
- Fine-tuning test configurations to improve accuracy.
Apdex Scoring
Learn how Apdex scoring measures user satisfaction with performance
Run Results
Understand how to interpret detailed load test results